|
Introduction
Primary
health care (PHC) is essential for improving
population health, reducing health disparities,
and achieving greater health equity. The World
Health Organization (WHO) and global health
entities emphasize primary care as the
"programmatic engine" for achieving Universal
Health Coverage (UHC), health-related Sustainable
Development Goals (SDGs), and health security [1].
Primary healthcare centers (PHCCs) are fundamental
to effective health systems, acting as the first
point of contact and providing essential services
that contribute significantly to health outcomes,
disease prevention, and health promotion [2,3].
However, the uneven spatial distribution of these
centers often exacerbates health inequalities,
particularly in underserved or rural areas). When
primary care infrastructure does not align with
population needs, vulnerable groups—such as rural
residents or low-income populations—face barriers
to access, leading to disparities in health
status, survival rates, and overall longevity
[3,4,5].
Despite these
established benefits, equity in PHC resource
allocation remains a critical challenge worldwide.
Disparities in resource distribution and
utilization often stem from complex social,
structural, and economic factors [3,6-8]. Across
many health systems, the spatial allocation of PHC
facilities fails to align with true population
needs, particularly in underserved regions [8,9].
Achieving equity in the distribution of PHC
resources remains a global challenge, with
disparities influenced by social, economic, and
structural factors that hinder equitable access
and utilization [3,9-13].
In Saudi Arabia,
substantial progress has been made in expanding
health care infrastructure, including primary
healthcare facilities [14-16]. Despite these
investments, disparities in resource distribution
persist across regions, reflecting unequal access
and potential inequalities in health outcomes.
Existing studies have highlighted regional
disparities in the distribution of health
workforce and hospitals [17-26]. These studies
demonstrate significant intra-regional and
socio-spatial disparities in the distribution of
physicians, dentists, and nurses across the
Kingdom. While urban populations generally
experience superior healthcare access compared to
their rural counterparts—a gap largely driven by
higher income and education levels, intra-urban
inequities remain pronounced. Even within major
metropolitan areas like Riyadh,
neighbourhood-level variations persist regarding
access to urgent and primary care services [13,
26]. Furthermore, regional progress remains
uneven: while territories such as the Eastern
Province have successfully expanded their primary
healthcare (PHC) footprint, other regions continue
to face resource deficits relative to their
population burden, ultimately driving divergent
health outcomes nationwide [13, 17,20]
To address these
disparities, the Saudi government has prioritized
primary care optimization under the aegis of Saudi
Vision 2030 [27], the Health Sector Transformation
Program (HSTP) [28]. These strategic policy
frameworks aim to construct a comprehensive,
integrated, and sustainable healthcare system that
ensures fair geographical coverage—especially for
rural and underserved populations. Achieving these
ambitious national objectives requires
evidence-based, targeted resource allocation.
Evaluating the spatial equity and concentration of
PHC infrastructure and human resources is
therefore crucial to informing policy decisions
and building a resilient primary care system in
Saudi Arabia. Accordingly, the main objective of
this study is to evaluate the spatial equity and
geographic concentration of primary healthcare
infrastructure and human resources across the
Kingdom of Saudi Arabia.
Materials and Methods
Study Design and Data Sources
This study employed
a descriptive analytical design to evaluate equity
and structural concentration in primary healthcare
(PHC) resource allocation across the 20 health
regions of the Kingdom of Saudi Arabia from 2015
to 2022. Data were extracted from the annual
Statistical Yearbooks [29] published by the
Ministry of Health (MOH). The dataset included all
20 MOH health regions, portraying annual data for
three core PHC resources: Primary Healthcare
Centers (PHCCs), Physicians employed in PHCCs, and
nursing staff employed in PHCCs. Likewise,
regional population statistics for each
corresponding year were obtained from the MOH
Statistical Yearbooks. To account for missing
region-specific population figures in the 2021
yearbook, linear interpolation was applied by
computing the mean of the 2020 and 2022 population
figures for each health region. Data cleaning,
validation, and managing missing values were
executed using Microsoft Excel, while statistical
computations were performed using Stata (Version
14/SE, StataCorp, College Station, TX).
Measurement
of Equity and Concentration Indicators
To rigorously
measure distribution equity and resource
concentration, two complementary economic indices
were calculated: the Gini Coefficient and the
Herfindahl–Hirschman Index (HHI).
1. Gini
Coefficient (Lorenz Curve Analysis)
The Gini coefficient
measures inequality in resource distribution
relative to population proportions. Graphically
based on the Lorenz curve, it quantifies the area
between the line of perfect equality (the
45-degree diagonal) and the cumulative proportion
of resources mapped against the cumulative
population share [30].
The Gini coefficient
(G) was calculated using Brown’s formula: 
Where:
- Xi represents the cumulative
proportion of the population in health region
(ordered from lowest to highest per-capita
resource share).
- Yi represents the cumulative
proportion of the healthcare resource (PHCCs,
physicians, or nurses) in health regions
- n denotes the total number of health regions
(n = 20).
Gini values range
continuously from 0 to 1:
- < 0.20: Perfect or near-perfect equality
- 0.20 - 0.29: High degree of equality
- 0.30 - 0.39: Moderate inequality
- 0.40 - 0.59: Severe inequality
- 0.60 <: Absolute inequality
2. Herfindahl–Hirschman Index (HHI)
While the Gini coefficient measures equity
relative to population density, the HHI assesses
structural market/regional concentration of
resources across the 20 health regions.
The HHI was calculated as the sum of the squared
regional percentage shares for each health
resource [31]: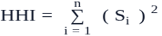
Where:
- n represents the number of health regions (n =
20).
- Si denotes the percentage share of a specific
resource (PHCCs, physicians, or nurses) located
within region i.
The theoretical range of the HHI spans from near
0 up to 10,000 (where 10,000 indicates absolute
concentration in a single region):
- < 1,500: Low concentration (highly
dispersed distribution across regions)
- 1,500 - 2,500: Moderate concentration
- > 2,500: High concentration (heavy cluster
of resources in few regions)
Results
Demographic
and Descriptive Statistics
Between 2015 and
2022, PHC resources and population dynamics in
Saudi Arabia underwent structural shifts
characterized by facility consolidation alongside
workforce expansion (Table 1).
The national population increased by 2.07%,
growing from 31,521,418 in 2015 to 32,175,224 in
2022.
The overall
trajectory of primary healthcare facilities did
not track population growth. The total number of
PHCCs fell by 7.09% nationally (from 2,282
facilities in 2015 to 2,120 in 2022). Conversely,
human resource capacity at the primary care level
experienced steady expansion, with PHC physicians
increased by 11.10% (from 9,647 to 10,718), and
PHC nurses by 9.42% (from 18,745 to 20,510). The
expansion of healthcare personnel relative to the
reduction in physical facilities indicates a
strategic consolidation toward larger,
higher-capacity centers with greater provider
density per facility.
|
Table 1: Rate of change in
population and number of PHCCs,
physicians, and nurses in Saudi Arabia,
2015-2022
|
|
Factor
|
2015
|
2022
|
% change
|
|
Total population
|
31,521,418
|
32175224
|
2.07
|
|
Number of PHCCs
|
2282
|
2120
|
-7.09
|
|
Physicians in PCCs
|
9647
|
10718
|
11.10
|
|
Nurses in PHCCs
|
18745
|
20510
|
9.42
|
Note: Data derived from Saudi Ministry of
Health Statistical Yearbooks (2015–2022).
Regional Distribution and Availability
Densities
At the regional
level, substantial disparities were observed in
density of health resources per 10,000 population
across the 20 health regions (Table 2).
High-density in urban areas consistently
demonstrated lower per-capita resource ratios due
to large population denominators, whereas smaller
or more remote health regions exhibited higher
per-capita resource availability. In 2022, urban
centers such as Jeddah (0.2), Makkah (0.3),
Eastern Region (0.3), and Riyadh (0.4) maintained
lower facility densities, compared with less
populated regions like Al Baha (2.7) and Bisha
(2.0). Lower physician ratios were concentrated in
Jeddah (1.9), Riyadh (2.1), and Makkah (2.5),
whereas higher ratios were reported in Al Baha
(10.9), Bisha (9.5), and the Northern Region
(7.6). Availability of nursing staff followed a
matching pattern, ranging from lower ratios in
Jeddah (2.4), Makkah (3.8), and Riyadh (3.9) to
higher ratios in Al Baha (17.9), Bisha (15.7), and
Al-Jouf (15.6).
|
Table 2: Number of Primary Health
Care Centres, Physicians, and Nurses in
the 20 Health Regions in Saudi Arabia
(per 10,000 population) 2015 - 2022
|
|
Regions
|
2015
|
2016
|
2017
|
2018
|
2019
|
2020
|
2021
|
2022
|
|
PHCCs
|
Physicians
|
Nurses
|
PHCCs
|
Physicians
|
Nurses
|
PHCCs
|
Physicians
|
Nurses
|
PHCCs
|
Physicians
|
Nurses
|
PHCCs
|
Physicians
|
Nurses
|
PHCCs
|
Physicians
|
Nurses
|
PHCCs
|
Physicians
|
Nurses
|
PHCCs
|
Physicians
|
Nurses
|
|
Taif
|
0.9
|
3.9
|
8.6
|
0.9
|
4.1
|
9.1
|
0.9
|
4.5
|
9.3
|
0.9
|
3.8
|
8.6
|
0.7
|
3.8
|
7.8
|
0.8
|
4.71
|
6.2
|
0.9
|
2.9
|
7.3
|
0.9
|
3.9
|
8.6
|
|
Jeddah
|
0.2
|
2.1
|
3.1
|
0.2
|
2.1
|
3.1
|
0.2
|
1.3
|
1.4
|
0.2
|
1.4
|
1.4
|
0.2
|
1.4
|
1.9
|
0.2
|
2.67
|
2.5
|
0.2
|
1.4
|
2.2
|
0.2
|
1.9
|
2.4
|
|
Makkah
|
0.3
|
2.5
|
4.5
|
0.4
|
2.6
|
4.7
|
0.3
|
2.8
|
4.7
|
0.3
|
2.5
|
4.4
|
0.3
|
2.5
|
4.3
|
0.3
|
3.37
|
3.8
|
0.2
|
1.6
|
3.1
|
0.3
|
2.5
|
3.8
|
|
Riyadh
|
0.5
|
1.9
|
3.9
|
0.5
|
2.0
|
4.1
|
0.5
|
2.3
|
4.3
|
0.5
|
2.9
|
4.6
|
0.4
|
2.9
|
4.0
|
0.4
|
2.77
|
3.8
|
0.4
|
1.6
|
3.3
|
0.4
|
2.1
|
3.9
|
|
Al-Ahsa
|
0.6
|
3.7
|
5.1
|
0.5
|
3.7
|
5.4
|
0.5
|
3.5
|
5.7
|
0.5
|
3.3
|
5.8
|
0.5
|
3.3
|
5.3
|
0.5
|
4.27
|
4.6
|
0.5
|
1.3
|
3.1
|
0.5
|
3.2
|
5.3
|
|
Eastern
|
0.4
|
2.4
|
3.7
|
0.4
|
2.7
|
4.2
|
0.4
|
2.2
|
3.3
|
0.4
|
3.1
|
6.2
|
0.4
|
3.0
|
5.4
|
0.3
|
3.30
|
4.5
|
0.3
|
2.1
|
4.3
|
0.3
|
2.5
|
4.6
|
|
Qaseem
|
1.2
|
5.4
|
8.3
|
1.3
|
5.6
|
8.8
|
1.2
|
4.8
|
8.7
|
1.2
|
5.0
|
10.0
|
1.0
|
5.0
|
9.7
|
1.0
|
6.50
|
7.2
|
1.2
|
3.4
|
7.4
|
1.1
|
5.2
|
9.1
|
|
Madina
|
0.7
|
3.3
|
7.4
|
0.7
|
3.2
|
7.3
|
0.7
|
3.6
|
7.7
|
0.7
|
3.3
|
7.9
|
0.6
|
3.3
|
7.1
|
0.6
|
4.46
|
5.9
|
0.6
|
3.2
|
7.8
|
0.6
|
3.7
|
7.9
|
|
Tabouk
|
0.8
|
2.4
|
6.3
|
0.9
|
2.4
|
6.9
|
0.9
|
2.7
|
7.4
|
1.0
|
4.0
|
7.4
|
1.0
|
4.0
|
8.71
|
0.9
|
5.98
|
8.1
|
1.0
|
3.3
|
9.9
|
0.9
|
4.6
|
11.6
|
|
Bishah
|
2.0
|
4.3
|
8.7
|
2.2
|
6.2
|
11.2
|
2.2
|
7.4
|
11.8
|
2.1
|
7.6
|
10.2
|
1.8
|
7.6
|
10.5
|
1.7
|
7.53
|
8.8
|
2.0
|
8.6
|
13.3
|
2.0
|
9.5
|
15.7
|
|
Aseer
|
1.3
|
4.7
|
8.9
|
1.3
|
4.9
|
8.9
|
1.4
|
4.5
|
7.4
|
1.3
|
6.1
|
8.6
|
1.3
|
6.1
|
9.5
|
1.2
|
5.45
|
7.0
|
1.2
|
5.5
|
10.5
|
1.2
|
6.2
|
10.9
|
|
Haf.baten
|
0.8
|
3.9
|
13.5
|
0.9
|
4.8
|
16.7
|
0.8
|
5.0
|
17.9
|
0.8
|
4.3
|
13.4
|
0.7
|
4.3
|
13.3
|
0.7
|
5.18
|
10.6
|
0.7
|
2.2
|
12.7
|
0.8
|
3.3
|
14.3
|
|
Najran
|
1.1
|
3.9
|
8.3
|
1.2
|
4.7
|
10.2
|
1.2
|
4.6
|
9.0
|
1.1
|
5.0
|
8.1
|
1.1
|
5.0
|
9.1
|
1.1
|
6.36
|
7.6
|
1.1
|
3.4
|
8.0
|
1.1
|
3.7
|
10.0
|
|
Jazan
|
1.1
|
3.9
|
8.5
|
1.2
|
4.4
|
9.2
|
1.1
|
4.3
|
7.5
|
1.1
|
4.6
|
8.8
|
1.0
|
4.6
|
8.7
|
1.0
|
5.04
|
6.6
|
1.1
|
3.7
|
8.4
|
1.2
|
4.9
|
9.1
|
|
Northern
|
1.2
|
5.8
|
9.8
|
1.3
|
5.9
|
10.8
|
1.3
|
6.6
|
11.5
|
1.2
|
7.4
|
11.2
|
1.1
|
7.4
|
12.4
|
1.0
|
9.75
|
11.3
|
1.0
|
7.0
|
10.9
|
1.0
|
7.6
|
12.7
|
|
Hail
|
1.5
|
5.0
|
12.2
|
1.5
|
5.0
|
12.3
|
1.2
|
5.3
|
13.2
|
1.5
|
5.0
|
13.1
|
1.4
|
5.0
|
11.8
|
1.4
|
6.15
|
9.7
|
1.4
|
3.4
|
9.2
|
1.4
|
3.9
|
11.0
|
|
Qunfudah
|
1.2
|
4.1
|
7.3
|
1.2
|
4.8
|
7.3
|
1.4
|
4.9
|
5.9
|
1.3
|
4.9
|
6.9
|
1.3
|
4.9
|
7.2
|
1.3
|
6.68
|
6.5
|
1.6
|
5.5
|
8.2
|
1.3
|
5.7
|
8.1
|
|
Qurayyat
|
0.9
|
2.2
|
8.6
|
1.1
|
4.5
|
10.1
|
1.0
|
5.5
|
12.1
|
1.1
|
5.0
|
11.1
|
1.1
|
5.0
|
12.4
|
1.1
|
7.26
|
12.4
|
0.8
|
1.7
|
7.7
|
0.8
|
3.9
|
12.8
|
|
Al-Jouf
|
1.2
|
5.1
|
16.5
|
1.2
|
5.5
|
17.3
|
1.3
|
5.7
|
17.2
|
1.2
|
6.3
|
16.6
|
1.2
|
6.3
|
16.2
|
1.1
|
7.50
|
12.4
|
1.0
|
5.1
|
15.7
|
0.9
|
5.3
|
15.6
|
|
Al Baha
|
2.2
|
6.6
|
13.0
|
2.2
|
7.0
|
13.4
|
2.3
|
7.6
|
13.4
|
2.2
|
7.1
|
12.5
|
1.8
|
7.1
|
11.7
|
1.8
|
9.15
|
10.1
|
2.7
|
9.3
|
16.1
|
2.7
|
10.9
|
17.9
|
|
0.7
|
3.0
|
8.6
|
0.9
|
3.2
|
6.2
|
0.7
|
3.2
|
5.9
|
0.7
|
3.5
|
6.3
|
0.6
|
3.5
|
6.1
|
0.6
|
4.11
|
5.2
|
0.6
|
2.6
|
5.5
|
0.65
|
3.3
|
6.3
|
Table 4 shows that
the density of PHCCs remained largely stable over
the 8 years, maintaining an overall mean near 1.0
per 10,000 population. Regional disparities ranged
from a low of 0.19 in 2016 to a high of 2.77 in
2021. With the improvement in medical coverage
over time, the mean physician density rose from
3.88 to 4.76 per 10,000 population. However,
regional inequality widened, peaking at a maximum
density of 10.90 physicians per 10,000 in 2022
compared to a historic regional low of 1.37 in
2017. Nursing capacity recorded the largest net
growth among healthcare resources, increasing its
overall mean density from 8.34 to 9.82 per 10,000
population. It also displayed significant regional
variance, reaching up to 17.95 nurses per 10,000
in 2022 versus a minimum of 1.45 in 2017.
|
Table 3: Descriptive statistics
of health resources (per 10,000
population) in the health regions,
2015-2022
|
|
Indicator
|
Regional Minimum
(Mean / SD)
|
Regional Maximum (Mean / SD)
|
Regional Density Trend
|
|
PHCCs / 10,000
|
0.19 (2016)
|
2.77 (2021)
|
Constant overall mean (1.04 in 2015 to
1.02 in 2022; SD: 0.09–0.13).
|
|
Physicians / 10,000
|
1.37 (2017)
|
10.90 (2022)
|
Increased overall mean (3.88 in 2015 to
4.76 in 2022; SD: 0.30–0.52).
|
|
Nurses / 10,000
|
1.45 (2017)
|
17.95 (2022)
|
Increased overall mean (8.34 in 2015 to
9.82 in 2022; SD: 0.50–0.98).
|
|
Regional Population
|
165,736 (2016)
|
8,872,712 (2020)
|
Mean regional population expanded through
2020 (1.75million), diminishing slightly
by 2022 (1.61million).
|
Distribution
Equity: Gini Coefficient Analysis
The Gini coefficient
was calculated to measure equality in the
distribution of PHC resources relative to regional
population shares. Across all three resource
categories, Gini index values remained below 0.30,
indicating a high overall degree of distribution
equality across the 20 health regions (Table 4).
|
Table 4: Gini Coefficients for
Health Resources at the PHCCs
(2015-2022)
|
|
Resources
|
Year
|
Mean (SD)
|
95% CI
|
|
2015
|
2016
|
2017
|
2018
|
2019
|
2020
|
2021
|
2022
|
|
Lower
|
Upper
|
|
PHCCs
|
0.262
|
0.269
|
0.270
|
0.268
|
0.277
|
0.272
|
0.271
|
0.266
|
0.269
(0.001)
|
0.262
|
0.277
|
|
Physicians in PHCCs
|
0.147
|
0.164
|
0.180
|
0.145
|
0.192
|
0.167
|
0.236
|
0.202
|
0.178
(0.010)
|
0.144
|
0.236
|
|
Nurses in PHCCs
|
0.198
|
0.207
|
0.254
|
0.232
|
0.240
|
0.197
|
0.269
|
0.254
|
0.231 (0.009)
|
0.197
|
0.269
|
PHCC Infrastructure showed high structural
stability over time, maintaining a lower Gini
range of 0.262 to 0.277 with a negligible standard
deviation (0.001). Facility closures during the
study period did not destabilize geographical
equity. The analysis showed that physician
distribution recorded lower baseline inequality
than PHCCs and nurses, though it exhibited greater
annual variability (SD = 0.010). However, the
distribution of nursing staff demonstrated
moderate inequality indices ranging from 0.197 to
0.269, with notable increases recorded in 2017
(0.254) and 2021 (0.269).
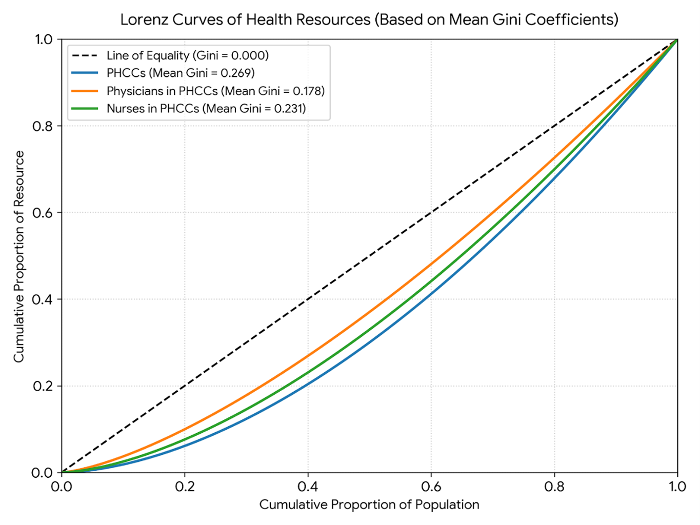
The Lorenz curves corresponding to the Gini
coefficients for PHCCs, Physicians, and nurses in
PHCCs from 2015 to 2022 are shown below:
|
| Fig
1: Lorenz curves corresponding to the Gini
coefficients for PHCCs, Physicians, and
nurses in PHCCs from 2015 to 2022 |
The figure shows that physicians in PHCCs exhibit
the lowest overall Gini coefficient (Mean G =
0.178), positioning their Lorenz curve closest to
the line of perfect equality (450
line). Physical PHCC infrastructure shows the
greatest inequality (Mean $G = 0.269$). Nurses in
PHCCs (Green Curve): Shows a moderate level of
inequality with a mean Gini coefficient of 0.231.
Structural Concentration:
Herfindahl–Hirschman Index (HHI) Analysis
The Herfindahl–Hirschman Index (HHI) was applied
to assess absolute market and geographic
concentration across the 20 regions. Benchmark HHI
values below 1,500 represent low concentration
(highly dispersed allocation), while values
exceeding 2,500 signal high concentration.
|
Table 5: Herfindahl-Hirschman
Index of Primary Health Care Resources
|
|
Year
|
PHCCs
|
Physicians
|
Nurses
|
|
2015
|
794.19
|
768.21
|
744.13
|
|
2016
|
801.48
|
760.22
|
734.05
|
|
2017
|
804.51
|
787.63
|
775.20
|
|
2018
|
807.99
|
931.74
|
811.31
|
|
2019
|
809.86
|
984.36
|
751.89
|
|
2020
|
799.12
|
766.39
|
787.12
|
|
2021
|
789.30
|
796.51
|
755.05
|
|
2022
|
793.25
|
780.92
|
737.28
|
Table 5 shows all
computed HHI values are ranged between 734.05 and
984.36, confirming that primary healthcare
resources in Saudi Arabia maintained a low degree
of concentration across health regions throughout
the 2015–2022 period. PHCC facilities remained the
most essentially static resource, whereas
physicians showed a temporary surge in
concentration during 2018–2019, then rebalancing
to 780.92 by 2022. Nurses displayed stable, low
concentration indices overall (734.05 to 811.31),
with no prolonged regional clustering observed.
Discussion
The findings of this
study reveal that despite expansion of healthcare
infrastructure, the distribution of primary
healthcare resources in Saudi Arabia remains
uneven, with regional disparities evident in the
number of PHCs, physicians, and nurses per 10,000
population. The use of inequality indices such as
the Gini coefficient and the Hirschman–Herfindahl
Index (HHI) indicates moderate but persistent
disparities, with certain regions experiencing
temporary fluctuations. Notably, the Gini
coefficients for PHCs and nurses suggest moderate
inequality, while physicians tend to be more
evenly distributed but with instances of
instability—particularly during 2019 and
2021—possibly reflecting recruitment and retention
challenges [29].
Earlier studies have
pointed out imbalances in how primary healthcare
facilities and hospital capacity are allocated
throughout the Kingdom. Calculating the Gini
coefficient to assess inequality, Al Sheddi et al.
[2] demonstrated that PHCs were distributed
relatively evenly across 20 health regions,
yielding the Gini coefficients ranging from 0.2 to
0.3. Nevertheless, the authors observed localized
inequities, highlighting that a more balanced
allocation is essential for optimizing healthcare
accessibility and patient outcomes. Similarly,
Saffer et al. [23] identified regional
inconsistencies in primary care center
availability, noting a pronounced urban clustering
of specialized medical personnel. Kattan [17]
observed the geographical inequities in the
distribution of PHCs during 2022. The study
underscores an imperative for equitable healthcare
accessibility across the Kingdom. Strategic
expansion of primary care infrastructure is
requisite in underserved territories to adequately
align service capacity with population demand.
Consequently, these empirical insights must be
systematically embedded into institutional policy
frameworks to advance the strategic objectives of
Vision 2030, specifically regarding the
establishment of a sustainable, equitable national
health system.
The low HHI values
across the years suggest that resource
concentration remains generally dispersed;
however, regional variations still impact
equitable access. The regional disparities in
healthcare workforce and infrastructure can
negatively influence health outcomes, underscoring
the importance of policy measures that focus on
equitable distribution aligned with population
needs [9,11,17-18]. Moreover, the slight decline
in the number of PHCs despite population growth
indicates a need for strategic planning to prevent
service gaps, especially as demographic shifts and
epidemiological transitions continue.
While Saudi Arabia
has made significant progress in expanding primary
healthcare infrastructure and workforce, ongoing
regional disparities pose challenges to achieving
true health equity. Strategic, data-driven
resource allocation, targeted policy
interventions, and innovative delivery models are
essential to bridge the gap between urban and
rural, and between high- and low-resource regions.
These findings were collaborated by earlier
studies in Saudi Arabia [16-17, 20,23,25].
Ultimately, these efforts are vital for realizing
the overarching goals of Saudi Vision 2030 and
ensuring that primary healthcare serves as an
equitable foundation for sustainable health
development across the kingdom.
To address the
persistent disparities in primary healthcare
resource distribution across Saudi Arabia, a
comprehensive, data-driven approach is essential.
Policymakers should prioritize strategic
geographic allocation by utilizing detailed
demographic and geographic data to identify
underserved regions and adjust resource
distribution accordingly. Expanding infrastructure
and leveraging telemedicine in rural and remote
areas can significantly improve access, while
incentivizing healthcare professionals—through
financial benefits, career development
opportunities, and mandatory service policies—can
help ensure a more equitable workforce
distribution. Capacity building initiatives,
including increased training programs and
retention strategies, are vital to sustain
workforce growth in underserved areas. Regular
monitoring and evaluation using indicators like
the Gini coefficient and HHI should be
institutionalized to track progress and enforce
accountability. Integrating these efforts within
national development frameworks such as Vision
2030 and fostering collaboration with local
communities and private sector partners will
ensure services are culturally appropriate and
tailored to regional needs. Additionally,
innovative delivery models like mobile clinics and
outreach programs, along with dedicated funding
and performance-based incentives, can further
promote equitable access. Implementing these
multi-faceted policies will help create a more
equitable, efficient, and sustainable primary
healthcare system that effectively serves all
regions of Saudi Arabia
Future research
should focus on evaluating the long-term impacts
of resource redistribution policies on healthcare
access and health outcomes across different
regions in Saudi Arabia. Additionally, studies
exploring the effectiveness of innovative service
delivery models, such as telemedicine and mobile
clinics, in reducing disparities are needed.
Investigating the barriers faced by healthcare
professionals in underserved areas and identifying
strategies to improve workforce retention and
motivation can also provide valuable insights.
Furthermore, incorporating patient perspectives
and community engagement into research can help
tailor policies to better meet local needs,
ultimately contributing to a more equitable and
resilient primary healthcare system.
Conclusion
This study provides a comprehensive evaluation of
PHC resource allocation across Saudi Arabia’s
health regions during a major health sector
transformation. The findings reveal a structural
shift toward resource optimization in primary care
physical infrastructure experienced mild
consolidation, while human workforce capacity
expanded considerably, outpacing national
population growth. The analysis confirms that
macro-level equity and structural dispersion of
PHC resources remain well-maintained nationwide.
However, per-capita analyses underscore persistent
regional imbalances. To fulfill the ambitions of
Saudi Vision 2030, future healthcare policy must
move beyond structural consolidation to address
sub-regional and local demographic demands.
Strategic interventions should focus on dynamic,
population-adjusted workforce distribution and
targeted infrastructure planning to ensure
equitable, timely access to primary care for all
communities.
References
- World Health Organization. Primary health
care: closing the gap. 2018; Geneva: WHO.
- Al-Sheddi A, Kamel S, Almeshal AS, Assiri AM.
Distribution of primary healthcare centers
between 2017 and 2021 across Saudi Arabia. Cureus.
2023; 15(7):e41932. https:// doi. org/ 10. 7759/
cureus. 41932.
- Akhavan, S. Promoting equity in primary health
care. Primary Health Care 5: 216.
doi:10.4172/2167-1079.1000216.
- World Health Organization. Primary health
care: Transforming health systems to achieve
universal health coverage. 2019; Geneva: WHO.
- Beaulieu. MD, Haggerty J, Tousignant P et al.
Characteristics of primary care practices
associated with high quality of care. CMAJ.
2013 Sep 3;185(12):E590-6. doi:
10.1503/cmaj.121802.
- Kusnali A, Nugraheni WP, Mubasyiroh R et al.
Urban-rural disparities in primary health care
utilization in Indonesia: a cross-sectional
study. Korean J Fam Med. 2026. doi:
10.4082/kjfm.25.0092.
- Gilliland JA, Shah TI, Clark A, Sibbald S,
Seabrook JA. A geospatial approach to
understanding inequalities in accessibility to
primary care among vulnerable populations. PloS
one. 2019;14(1):e0210113.
- Tangcharoensathien V, Lekagul A, Teo YY.
Global health inequities: more challenges, some
solutions. Bull World Health Organ. 2024;102(2):86-86A.
doi: 10.2471/BLT.24.291326.
- Omrani-Khoo H, Lotfi F, Safari H, Zargar
Balaye JS, Moghri J, Shafii M. Equity in
distribution of health care resources;
assessment of need and access, using three
practical indicators. Iran J Public Health.
2013;42(11):1299–308.
- Rice N, Smith PC. Ethics and geographical
equity in health care. J Med Ethics.
2001;27(4):256–61
- Tian F, Pan J. Hospital bed supply and
inequality as determinants of maternal mortality
in China between 2004 and 2016. Int J
Equity Health. 2021;20(1):51. https://
doi. org/ 10. 1186/ s12939- 021- 01391-9.
- Wang Y, Li Y, Qin S, Kong Y, Yu X, Guo K, and
Meng J. The disequilibrium in the distribution
of the primary health workforce among eight
economic regions and between rural and urban
areas in China. Int J Equity Health.
2020; 19:28 https://doi.org/10.1186/s12939-020-1139-3.
- Liu J, Eggleston K. The association between
health workforce and health outcomes: a
cross-country econometric study. Soc Indic
Res 2022;163(2):609-632.
- Albejaidi F, Nair K S. Nationalisation of
health workforce in Saudi Arabia’s public and
private sectors: a review of issues and
challenges. J Health Manag. 2021;
23(3). Available at https://journals.sagepub.com/doi/abs/10.1177/09720634211035204.
- Albejaidi F, Nair KS. Building the health
workforce: Saudi Arabia's challenges in
achieving Vision 2030. Int J Health Plann
Manage 2019;34(4):e1405-e1416. doi:
10.1002/hpm.2861.
- Nair KS, Pasha SA. Measuring inequalities in
the distribution of health professionals: the
case of Saudi Arabia. Online J Health
Allied Scs. 2025;24(3):4.
- Kattan, W. The state of primary healthcare
centers in Saudi Arabia: A regional analysis for
2022. PLoS ONE 2024; 19(9): e0301918. https://doi.org/10.1371/journal.pone.0301918
- Alghamdi K, Aljohani A, Taha J, Qari L,
Demyati M, Alzahrani S. Public awareness and
utilization of the primary health care services
in Al-Madinah, Saudi Arabia. Middle East J
Family Med. 2020;18(2):33-41.
- A’aqoulah A, AlAhmari R, Alahmary K, Al
Sudairy AA, Innab N, Abu Saris R. Factors
affecting utilization of primary healthcare
services in Saudi Arabia. INQUIRY: J.
Health Care Organ. Provis. Financ.2025;62.
doi:10.1177/00469580251326444
- Kattan W, Al-Hanawi MK. Inequalities in the
distribution of the nursing workforce in the
Kingdom of Saudi Arabia: a regional analysis. Hum
Resour Health 23, 34 (2025).
https://doi.org/10.1186/s12960-025-01010-6
- Kattan W, Al-Hanawi MK. Inequalities in the
distribution of the family physician workforce
in the Kingdom of Saudi Arabia: a regional
analysis. Int J Equity Health (2026).
https://doi.org/10.1186/s12939-026-02962-4
- Asmri MA, Almalki M, Fitzgerald G, et al. The
public health care system and primary care
services in Saudi Arabia: a system in
transition. East Mediterr Health J.
2020;26(4):468–476. doi: 10.26719/emhj.19.049
- Al Saffer Q, Al-Ghaith T, Alshehri A, et al.
The capacity of primary health care facilities
in Saudi Arabia: infrastructure, services, drug
availability, and human resources. BMC
Health Serv Res. 2021;21(1):1–15. doi:
10.1186/s12913-021-06355-x.
- Kattan W. Regional Inequality in the
distribution of dentists in Saudi Arabia by
sector and nationality: A 2023 National analysis
under Vision 2030. PLoS One 2026; 21(4):
e0348204. https://doi.org/10.1371/journal.pone.0348204.
- El-Farouk A. Geographical distribution of
health resources in the Kingdom of Saudi Arabia:
is it equitable? Egypt J Environ Change. 2016;8:4–20.
- Mansour S. Spatial analysis of public health
facilities in Riyadh Governorate, Saudi Arabia:
a GIS-based study to assess geographic
variations of service provision and
accessibility. Geo Spatial Inform Sci. 2016;19(1):26–38.
- Kingdom of Saudi Arabia. Saudi Arabia's Vision
2030. http//www.vosion2030.gov.sa/en/ntp.
- Kingdom of Saudi Arabia. Saudi Arabia's
National Transformation Program.
https://vision2030.gov.sa / sites/default/
files/NTP_En.pdf.
- Ministry of Health, Statistical Yearbook.
Riyadh. Ministry of Health. 2023, Kingdom of
Saudi Arabia.
- Okasha HS, Alshammari HA. Spatial distribution
of primary government healthcare centers in Hail
City using geographic information systems. Kurdish
Studies. 2023;11(2):3671–3694
- Nasiri A, Yusefzadeh H, Amerzadeh M, Moosavi
S, Kalhor R. Measuring inequality in the
distribution of health human resources using the
Herfindahl-Hirschman index: a case study of
Qazvin Province. BMC Health Serv Res
2022; 22, 1161.
https://doi.org/10.1186/s12913-022-08518-w.
|


