|
Introduction
Drowning
is among the leading causes of
unintentional-injury death in Indian children, yet
India is one of the few high-burden countries
without a dedicated national prevention
strategy.(1,2) The World Health Organization's
2024 global status report asks every member state
to halve drowning deaths by 2030 and sets out ten
recommended interventions spanning supervised day
care, swimming and water-safety skills, barriers
around water, life jackets, bystander rescue,
flood warning, resilient infrastructure, boating
standards, public awareness and school
curricula.(1)
Translating that
target into Indian policy requires answers to four
questions the published literature has not
addressed. How completely do routine systems
record child drowning? Where does burden
concentrate once measurement error is accounted
for? Which states combine high burden with weak
capacity to deliver a programme? And what does the
evidence actually support about which
interventions to fund first?
Each question is
obstructed by a data limitation. The National
Crime Records Bureau publication Accidental Deaths
and Suicides in India reports drowning deaths by
state and, separately, by age, but publishes no
state-by-age cross-tabulation, and collapses the
highest-risk under-five band into a single
below-14 category.(3) The Sample Registration
System reports an aggregate injuries category and
does not disaggregate drowning.(4) Global Burden
of Disease estimates provide age-specific state
figures but are themselves modelled outputs
carrying wide uncertainty.(2)
A further limitation
shapes what any prioritisation can claim. No
Indian state publishes an administrative indicator
of water-safety programme activity: there is no
series for swim-training coverage, no register of
fenced water bodies and no published
rescue-service density. That absence is not a gap
in this analysis but a finding about the Indian
policy environment.
This study therefore
matches its methods to the evidence available.
Rather than treating either data source as
correct, it combines them in a measurement-error
model that estimates how completely deaths are
recorded. Rather than scoring state readiness on
judgement, it uses measured indicators and reports
classification as a probability. Rather than
ranking interventions on effect sizes the
literature does not support, it propagates the
uncertainty in that literature and reports what
can be concluded.
Material and Methods
Study design
and reporting
This was a
cross-sectional secondary analysis of nationally
representative aggregate data for 2014-2023,
combining Bayesian hierarchical modelling with
multi-criteria decision analysis. Reporting
follows the Strengthening the Reporting of
Observational Studies in Epidemiology statement
for cross-sectional studies, and a completed
checklist is provided as Supplementary Table
S1.(5)
Ethical
considerations
This study used only
publicly available aggregated secondary data with
no individual-level or identifiable information.
No individual was enrolled, contacted or
intervened upon, and no identifiable personal
record or biological specimen was accessed.
Institutional review board approval and informed
consent were not applicable.
Data sources
State-level drowning
deaths with 95% uncertainty intervals for the
three paediatric age bands, both sexes, 2014-2023,
were taken from the Global Burden of Disease 2023
release.(2) Drowning deaths by state and by age
for 2023 were extracted from the National Crime
Records Bureau.(3) State-level capacity and
contextual indicators were computed from the
National Family Health Survey-5 district
factsheet, aggregating 707 district records to
state level.(6) The national 0-14 denominator came
from World Population Prospects 2024.(7) The
intervention set came from the World Health
Organization 2024 global status report.(1)
Analyses covered the
30 states for which the Global Burden of Disease
reported state-level paediatric drowning and the
National Family Health Survey-5 reported the
capacity indicators. The Global Burden of Disease
aggregate for other union territories has no
counterpart in any state-level covariate source
and was excluded by name. The National Crime
Records Bureau state table for 2023 sums to 37,518
of 37,738 national drowning deaths, a shortfall of
220 (0.6%) attributable to Delhi, which the table
omits; Delhi therefore contributes through the
Global Burden of Disease likelihood alone.
Child
population denominators
State child
populations for 2023 were obtained by applying the
National Family Health Survey-5 measured under-15
share to a 2023 state population and normalising
to the World Population Prospects national 0-14
total. This was preferred to apportioning the
national total by Census 2011 state shares,
because the published share table resolves shares
to three decimal places and therefore assigns an
identical share, and an identical child
population, to several small states, distorting
their rates. The Census-share denominator was
retained as a sensitivity analysis.
Two-source
burden model
For each state s,
the paediatric drowning rate per 100 000 was
modelled hierarchically on the log scale, giving
true deaths D(s) for child population N(s). Two
likelihoods were specified: the Global Burden of
Disease estimate as a normal measurement of D(s)
with standard deviation implied by its published
uncertainty interval, and the recorded all-age
drowning count as a negative-binomial observation
with mean D(s) multiplied by a recording ratio
k(s). The logarithm of k(s) was regressed on
standardised death-registration completeness with
a state-level random effect.
The quantity k(s) is
the number of recorded all-age drowning deaths per
true child drowning death in state s. Because no
state-by-age cross-tabulation is published, k(s)
deliberately absorbs the paediatric share together
with recording completeness rather than fixing the
paediatric share at its national value. Only k(s)
is identified by the recorded count alone; partial
pooling across states, and the regression of k(s)
on measured registration completeness, are what
allow the second source to carry information about
D(s). The prior on the intercept was centred on
the national ratio of recorded all-age to
estimated paediatric deaths.
To establish whether
the second source materially changes the answer,
the identical model was refitted with the second
likelihood removed and posterior rates compared
state by state.
Trajectory
and projection
The national 0-14
rate was modelled as a Bayesian segmented
regression with a break at 2020. The level-change
parameter identifies a discontinuity in the
series; it does not identify its cause, and no
causal interpretation is placed on it.
The national rate
was projected to 2030 with a smooth-trend local
linear model fitted on the log scale. Beyond the
observed series the trend was damped by a factor.
Ten annual observations do not identify that
factor, so rather than fixing it, a Beta(6, 2)
prior was placed over it and integrated out,
concentrating mass on the range used in the
damped-trend forecasting literature while
retaining mass on weak persistence.(8) Because the
data do not update it, its posterior equals its
prior, and the reported probability expresses
uncertainty about trend persistence rather than
evidence about it. Probabilities conditional on
fixed damping, under alternative damping priors,
and under alternative variance priors are reported
alongside.
State
priority index
A priority index was
computed by the Technique for Order of Preference
by Similarity to Ideal Solution over six criteria:
posterior burden, where higher burden indicates
higher priority, and five capacity indicators,
where lower capacity indicates higher priority.(9)
The capacity indicators were birth registration,
death registration, institutional births, four or
more antenatal visits and household
health-insurance coverage, all measured in the
National Family Health Survey-5 and all covering
every state at 96% district completeness or
better. Indicators with poorer coverage were
excluded from the primary index and used in a
specification sensitivity analysis.
Two sources of
uncertainty were propagated jointly: posterior
uncertainty in state burden, by drawing from the
two-source model, and sampling uncertainty in each
state mean, by resampling districts within states.
Two thousand replicates were computed, and results
are reported as a score with a credible interval,
a rank with an interval, and the probability that
a state falls in the highest-priority third.
Sensitivity to weighting was assessed under
burden-favouring and capacity-favouring schemes.
Intervention
appraisal
Each of the ten
recommended interventions was matched to its
strongest published evidence for an effect on
drowning mortality, and effect estimates were
re-derived from the primary sources. Where an
interval was published, risk ratios were drawn
lognormally to match it. Where evidence
established direction but not magnitude, the draw
was deliberately broad. A single transferability
discount, drawn uniformly and applied identically
to every intervention in each draw, widened the
uncertainty arising from importing effects
estimated elsewhere without allowing a judgement
about which intervention suits India to drive the
ordering. Interventions were ranked over effect
and certainty of evidence across 20 000 draws, and
results are reported as rank-acceptability
probabilities.
Contextual
layers
State-level
contextual indicators were correlated with
posterior burden by Spearman rank correlation, and
repeated as partial correlations adjusting for a
composite development index defined as the first
principal component of six socioeconomic and
health-system indicators. These analyses are
ecological and exploratory and are reported as
associations only.
Statistical
analysis
All inference was
Bayesian except the contextual correlations.
Convergence was assessed by the Gelman-Rubin
statistic, bulk effective sample size and
divergent-transition count, all of which are
reported for every model in Supplementary Table
S2. Analyses used Python 3.14 with PyMC 6.0,
ArviZ, pandas, NumPy, SciPy and Matplotlib.(10)
Analytic code and processed data are available
from the author.
Results
National
trajectory
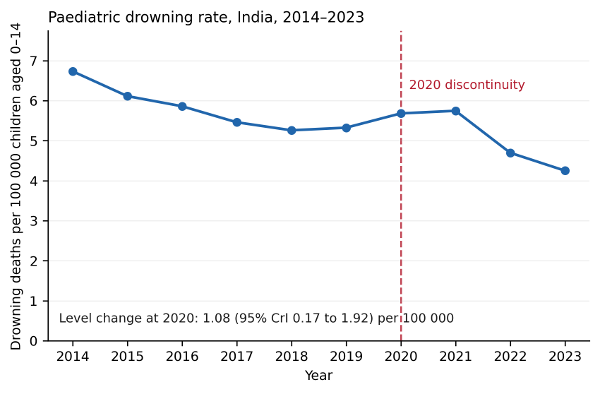
Paediatric drowning
deaths fell from 24,562 in 2014 to 14,913 in 2023,
a reduction of 39.3%, with the rate falling from
6.73 to 4.25 per 100 000 (Figure 1). The segmented
model fitted without divergent transitions and
with a maximum Gelman-Rubin statistic of 1.00. The
pre-2020 slope was negative, indicating continuous
decline. The level change at 2020 was 1.08 per 100
000 (95% credible interval 0.17 to 1.92), with
posterior probability 0.986 of being positive, and
the post-2020 slope change was negative,
indicating that the decline resumed.
|
| Figure
1: Paediatric drowning rate, India,
2014-2023. Points show the estimated
annual rate per 100 000 children aged
0-14. The dashed line marks 2020, the year
at which a level change was estimated. The
level change identifies a discontinuity in
the series and does not identify its
cause. |
This identifies a
discontinuity, not its cause. School closures,
monsoon flooding and pandemic-period changes in
death recording all coincided with 2020, and a
ten-point annual series cannot distinguish among
them or exclude ordinary year-to-year variation.
Recorded
against modelled counts
The National Crime
Records Bureau recorded 4,829 below-14 drowning
deaths in 2023, 12.8% of the 37,738 drowning
deaths it reported at all ages.(3) The
corresponding Global Burden of Disease estimate
for ages 0-14 was 14,913 deaths, 3.1-fold the
recorded count.
Both figures
estimate different things and neither is a census
of events. Global Burden of Disease figures are
model outputs produced by redistributing
ill-defined causes and correcting for incomplete
registration, and they carry wide intervals. The
ratio indicates the direction and approximate
scale of under-recording rather than an exact
multiplier. It is nonetheless large enough that
routine police records cannot serve as a
stand-alone monitoring source for paediatric
drowning.
State burden
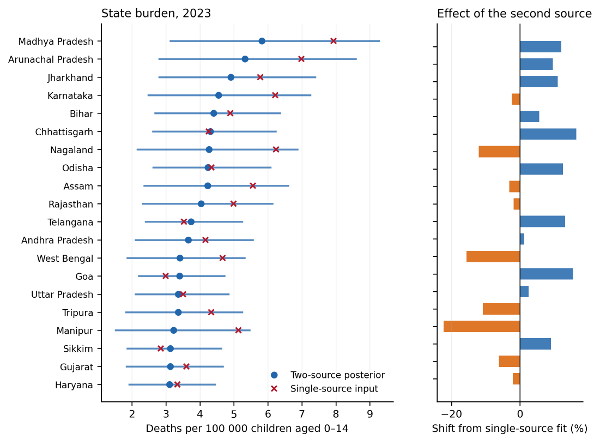
Admitting the second
source changed state estimates materially.
Posterior rates differed from a single-source fit
by a median of 6.0%, by up to 22.3%, and by more
than 10% in 11 of 30 states; they differed from
the raw modelled input rates by a median of 13.4%
(Figure 2). Death-registration completeness
predicted the recording ratio strongly
(coefficient 0.65, 95% credible interval 0.42 to
0.88, posterior probability of a positive
coefficient 1.00), confirming that states
registering deaths more completely also record
proportionately more drowning deaths.
|
| Figure
2: State paediatric drowning burden, 2023.
Left panel: posterior rate with 95%
credible interval from the two-source
model (circles) against the single-source
input rate (crosses), for the twenty
highest-burden states. Right panel:
percentage shift of the two-source
posterior from a fit using the modelled
source alone. |
Posterior rates
ranged from 1.52 per 100 000 in Delhi to 5.82 in
Madhya Pradesh, a 3.8-fold spread. The five
highest-burden states were Madhya Pradesh (5.82,
95% CrI 3.10-9.29); Arunachal Pradesh (5.32, 95%
CrI 2.78-8.61); Jharkhand (4.91, 95% CrI
2.78-7.42); Karnataka (4.55, 95% CrI 2.46-7.27);
Bihar (4.41, 95% CrI 2.66-6.39) (Table 1). The
two-source model showed 21 divergent transitions
in 8,000 draws and a maximum Gelman-Rubin
statistic of 1.01.
|
Table 1: State paediatric
drowning burden, 2023.
|
|
Rank
|
State
|
Posterior rate
|
95% CrI
|
GBD Input rate
|
Shift (%)
|
Recording ratio
|
|
1
|
Madhya Pradesh
|
5.82
|
3.10-9.29
|
7.93
|
+12.1
|
4.05
|
|
2
|
Arunachal Pradesh
|
5.32
|
2.78-8.61
|
6.98
|
+9.6
|
1.05
|
|
3
|
Jharkhand
|
4.91
|
2.78-7.42
|
5.77
|
+11.1
|
1.30
|
|
4
|
Karnataka
|
4.55
|
2.46-7.27
|
6.22
|
-2.4
|
4.66
|
|
5
|
Bihar
|
4.41
|
2.66-6.39
|
4.89
|
+5.6
|
1.15
|
|
6
|
Chhattisgarh
|
4.31
|
2.60-6.25
|
4.26
|
+16.4
|
5.32
|
|
7
|
Nagaland
|
4.26
|
2.13-6.89
|
6.24
|
-12.0
|
0.64
|
|
8
|
Odisha
|
4.24
|
2.60-6.10
|
4.34
|
+12.6
|
3.89
|
|
9
|
Assam
|
4.23
|
2.34-6.62
|
5.56
|
-3.1
|
2.13
|
|
10
|
Rajasthan
|
4.04
|
2.29-6.16
|
4.99
|
-1.8
|
3.33
|
|
11
|
Telangana
|
3.74
|
2.38-5.27
|
3.53
|
+13.2
|
4.64
|
|
12
|
Andhra Pradesh
|
3.66
|
2.08-5.58
|
4.16
|
+1.3
|
4.12
|
|
13
|
West Bengal
|
3.41
|
1.84-5.34
|
4.67
|
-15.6
|
2.43
|
|
14
|
Goa
|
3.40
|
2.18-4.75
|
2.99
|
+15.5
|
12.96
|
|
15
|
Uttar Pradesh
|
3.37
|
2.08-4.87
|
3.51
|
+2.5
|
1.45
|
|
16
|
Tripura
|
3.37
|
1.80-5.27
|
4.33
|
-10.9
|
2.83
|
|
17
|
Manipur
|
3.23
|
1.49-5.49
|
5.13
|
-22.3
|
0.88
|
|
18
|
Sikkim
|
3.13
|
1.84-4.66
|
2.85
|
+9.0
|
4.79
|
|
19
|
Gujarat
|
3.13
|
1.82-4.70
|
3.60
|
-6.1
|
5.27
|
|
20
|
Haryana
|
3.11
|
1.89-4.47
|
3.34
|
-2.1
|
4.58
|
|
21
|
Tamil Nadu
|
3.05
|
1.75-4.54
|
3.40
|
-4.4
|
5.40
|
|
22
|
Meghalaya
|
2.97
|
1.77-4.41
|
2.77
|
+5.8
|
1.83
|
|
23
|
Maharashtra
|
2.83
|
1.83-3.92
|
2.72
|
+4.0
|
5.95
|
|
24
|
Uttarakhand
|
2.39
|
1.45-3.46
|
2.27
|
-2.1
|
2.99
|
|
25
|
Kerala
|
2.19
|
1.40-3.08
|
1.77
|
+6.5
|
8.95
|
|
26
|
Punjab
|
2.14
|
1.32-3.09
|
2.03
|
-4.6
|
4.93
|
|
27
|
Himachal Pradesh
|
1.98
|
1.24-2.81
|
1.58
|
+3.2
|
7.25
|
|
28
|
Jammu and Kashmir and Ladakh
|
1.68
|
0.91-2.52
|
1.77
|
-15.6
|
1.91
|
|
29
|
Mizoram
|
1.62
|
0.98-2.31
|
1.22
|
+0.4
|
4.88
|
|
30
|
Delhi
|
1.52
|
0.87-2.21
|
1.08
|
-0.3
|
5.84
|
|
CrI, credible interval. The recording
ratio is the number of recorded all-age
drowning deaths per estimated child
drowning death.
Shift (%) is the percentage difference
between the two-source posterior and a
fit of the
same model to the Global Burden of
Disease
source alone.
|
Under the
Census-share denominator, state ranks correlated
with the primary ranking at a Spearman coefficient
of 0.90, with a median rank shift of 1 place but a
maximum shift of 12 places. Denominator choice
therefore leaves the broad ordering intact while
moving individual states substantially, and the
states it moves most are those whose Census shares
are least precisely resolved.
State
priority
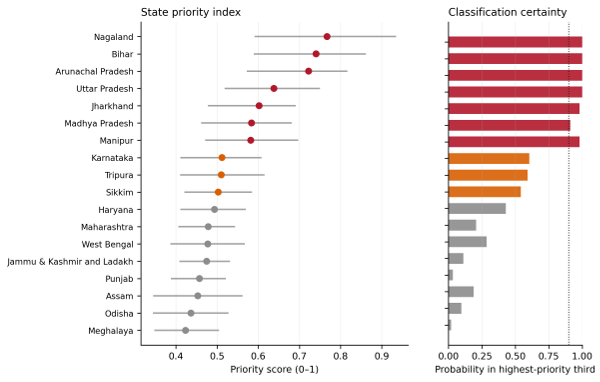
Combining burden
with measured capacity produced an ordering in
which 7 states fell in the highest-priority third
with probability at least 0.90: Nagaland, Bihar,
Arunachal Pradesh, Uttar Pradesh, Jharkhand,
Madhya Pradesh and Manipur (Figure 3, Table 2). A
further 8 states could not be classified with
confidence, their probability of belonging to the
highest-priority third lying between 0.10 and
0.90, and 15 states were confidently outside it.
The median width of the rank credible interval was
9 places.
|
| Figure
3: State priority index. Left panel:
priority score with 95% credible interval,
propagating posterior uncertainty in
burden and district sampling uncertainty
in the capacity indicators. Right panel:
probability that each state falls in the
highest-priority third. |
|
Table 2: State priority index.
|
|
Rank
|
State
|
Priority score
|
95% CrI
|
Rank interval
|
P(highest third)
|
|
1
|
Nagaland
|
0.767
|
0.591-0.935
|
1-5
|
1.00
|
|
2
|
Bihar
|
0.741
|
0.589-0.861
|
1-4
|
1.00
|
|
3
|
Arunachal Pradesh
|
0.722
|
0.572-0.817
|
1-5
|
1.00
|
|
4
|
Uttar Pradesh
|
0.638
|
0.518-0.750
|
2-7
|
1.00
|
|
5
|
Jharkhand
|
0.602
|
0.477-0.691
|
3-10
|
0.98
|
|
6
|
Madhya Pradesh
|
0.584
|
0.461-0.682
|
1-14
|
0.91
|
|
7
|
Manipur
|
0.582
|
0.471-0.697
|
3-10
|
0.98
|
|
8
|
Karnataka
|
0.512
|
0.411-0.608
|
5-17
|
0.60
|
|
9
|
Tripura
|
0.510
|
0.410-0.615
|
6-17
|
0.59
|
|
10
|
Sikkim
|
0.503
|
0.421-0.585
|
6-16
|
0.54
|
|
11
|
Haryana
|
0.494
|
0.411-0.570
|
7-16
|
0.43
|
|
12
|
Maharashtra
|
0.479
|
0.406-0.544
|
8-17
|
0.21
|
|
13
|
West Bengal
|
0.477
|
0.386-0.567
|
7-19
|
0.29
|
|
14
|
Jammu and Kashmir and Ladakh
|
0.475
|
0.408-0.532
|
9-17
|
0.11
|
|
15
|
Punjab
|
0.457
|
0.388-0.521
|
10-18
|
0.03
|
|
16
|
Assam
|
0.453
|
0.345-0.562
|
7-23
|
0.19
|
|
17
|
Odisha
|
0.437
|
0.344-0.528
|
8-24
|
0.097
|
|
18
|
Meghalaya
|
0.423
|
0.348-0.505
|
11-23
|
0.02
|
|
19
|
Delhi
|
0.409
|
0.350-0.464
|
16-23
|
0.00
|
|
20
|
Himachal Pradesh
|
0.399
|
0.337-0.455
|
17-23
|
0.00
|
|
21
|
Gujarat
|
0.392
|
0.319-0.472
|
15-25
|
0.00
|
|
22
|
Chhattisgarh
|
0.370
|
0.267-0.474
|
13-28
|
0.01
|
|
23
|
Telangana
|
0.362
|
0.279-0.448
|
17-27
|
0.00
|
|
24
|
Mizoram
|
0.359
|
0.275-0.456
|
17-28
|
0.00
|
|
25
|
Rajasthan
|
0.323
|
0.230-0.428
|
17-30
|
0.00
|
|
26
|
Andhra Pradesh
|
0.312
|
0.220-0.424
|
18-30
|
0.00
|
|
27
|
Uttarakhand
|
0.308
|
0.244-0.380
|
23-29
|
0.00
|
|
28
|
Kerala
|
0.287
|
0.239-0.337
|
25-29
|
0.00
|
|
29
|
Goa
|
0.253
|
0.174-0.340
|
24-30
|
0.00
|
|
30
|
Tamil Nadu
|
0.233
|
0.158-0.325
|
25-30
|
0.00
|
|
CrI, credible interval. Priority
combines posterior burden with five
measured child-health-system capacity
indicators.
|
The ordering was
robust to capacity-favouring weights (Spearman
coefficient 0.97) but only moderately robust to
burden-favouring weights (0.60), and moderately
robust to adding two further capacity indicators
for the states reporting them (0.73). The identity
of the highest-priority group is therefore
reasonably secure; the ordering within it is not,
and the boundary of the group depends on how
burden and capacity are weighted against each
other.
Projection
to 2030
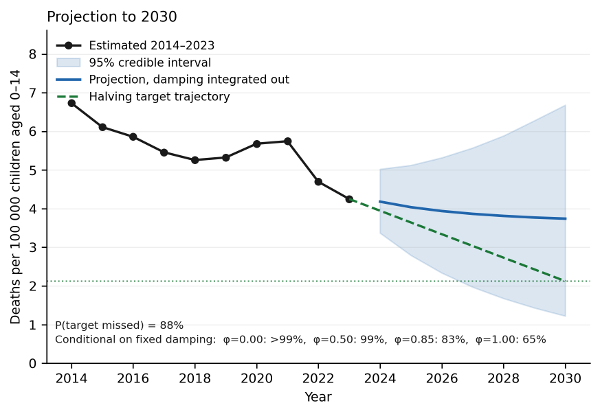
The projected 2030
rate was 3.74 per 100 000 (95% credible interval
1.22 to 6.68) against a halving target of 2.13
(Figure 4). Integrating over the damping prior,
the probability of missing the target was 88%. The
model showed 14 divergent transitions in 8,000
draws.
|
| Figure
4: Projection of the national paediatric
drowning rate to 2030. The shaded band is
the 95% credible interval with the trend
damping factor integrated out. The dashed
line is the trajectory implied by halving
the 2023 rate by 2030. Probabilities
conditional on fixed damping values are
shown because the damping factor is not
identified by the observed series. |
That figure is
sensitive to assumptions the data cannot inform.
Conditional on fixed damping, the probability is
65% if the fitted decline continues undamped and
above 99% if the trend does not persist at all.
Across alternative damping priors it ranges from
88% to 96%, and across the full set of damping and
variance specifications examined from 65% to above
99% (Supplementary Table S3).
The variance
specifications warrant a further caution. Ten
annual observations cannot separate observation
noise from trend innovation, and the two variances
trade off along a ridge. Under deliberately loose
variance priors the sampler does not explore that
geometry reliably, returning 923 divergent
transitions in 4,000 draws, so the probability it
reports should not be relied upon. The primary
specification uses tighter priors justified by the
scale of the observed series, and the sensitivity
analysis is reported chiefly to show that the
choice matters. The defensible conclusion is that
attainment of the 2030 target is unlikely but
highly uncertain under plausible extrapolation
assumptions, and that no single probability should
be treated as a planning input.
Intervention
evidence
Of the ten
recommended interventions, 2 had a published
quantitative effect estimate on drowning mortality
with an interval, 2 had moderate-certainty
evidence of benefit without a pooled magnitude,
and 6 had no identified controlled evaluation
reporting a mortality effect (Table 3; provenance
for each estimate is given in Supplementary Table
S4). A 2025 systematic review of swimming and
water-safety skills training reported that
heterogeneity across populations, interventions
and outcomes prevented any meta-analysis.(11)
|
Table 3. Evidence appraisal of
ten recommended interventions.
|
|
Rank
|
Intervention
|
Certainty
|
Quantified effect
|
RRR (95% CI)
|
Rank interval
|
P(top three)
|
|
1
|
Day care
|
Moderate
|
Direction only
|
-
|
1-4
|
0.842
|
|
2
|
Swim training
|
Moderate
|
Direction only
|
-
|
1-4
|
0.847
|
|
3
|
Fencing
|
Low
|
Yes
|
0.73 (0.53-0.84)
|
1-4
|
0.789
|
|
4
|
Life jackets
|
Low
|
Yes
|
0.67 (0.44-0.81)
|
2-5
|
0.518
|
|
5
|
School curriculum
|
Very low
|
None identified
|
-
|
5-10
|
0.001
|
|
6
|
Safer boating
|
Very low
|
None identified
|
-
|
5-10
|
0.001
|
|
7
|
Resilient infrastructure
|
Very low
|
None identified
|
-
|
5-10
|
0.001
|
|
8
|
Bystander CPR
|
Very low
|
None identified
|
-
|
5-10
|
0.001
|
|
9
|
Flood warning
|
Very low
|
None identified
|
-
|
5-10
|
0.001
|
|
10
|
Media campaigns
|
Very low
|
None identified
|
-
|
5-10
|
0.001
|
|
RRR, relative-risk reduction; CI,
confidence interval.
|
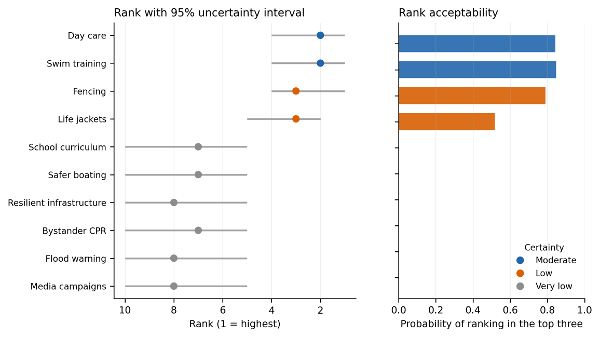
Propagating that
evidence, no intervention exceeded a probability
of 0.46 of ranking first (Supplementary Figure
S1). Day care and basic swimming and water-safety
training were indistinguishable from one another
at the top of the ordering, with probabilities of
ranking in the top three of 0.84 and 0.85
respectively, and both separated clearly from the
six interventions with no identified mortality
evidence, whose probability of ranking in the top
three did not exceed 0.001. Public-awareness media
campaigns, which have low unit cost and wide reach
but no published estimate of an effect on drowning
mortality in any setting, ranked 10 of 10.
These results do not
establish a ranking. They establish that only two
interventions can currently be distinguished from
the field on evidential grounds, that those two
cannot be distinguished from each other, and that
the remainder cannot be ordered at all.
Contextual
associations
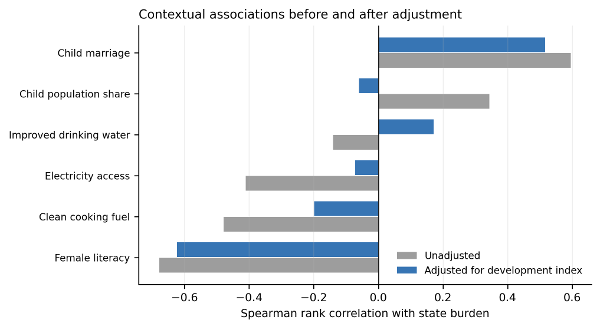
Of 6 contextual
layers tested, 4 were associated with posterior
state burden before adjustment. After adjusting
for the composite development index, which
accounted for 43% of the variance across its six
constituent indicators, 2 remained: female
literacy (coefficient -0.68 unadjusted, -0.62
adjusted) and child marriage prevalence (0.60
unadjusted, 0.52 adjusted) (Supplementary Table
S5, Supplementary Figure S2). Associations with
clean cooking fuel and electricity access did not
survive adjustment, attenuating from -0.48 to
-0.20 and from -0.41 to -0.07 respectively.
Most of the apparent
contextual signal is therefore attributable to
general state development rather than to specific
pathways. These are ecological associations across
30 state-level observations and support no
inference about individual risk or causal
mechanism.
Discussion
Principal
findings
Four findings
emerge. First, routine police records capture
roughly a third of the modelled paediatric
drowning burden, and how completely a state
registers deaths predicts how completely it
records drowning deaths. Second, combining two
sources rather than propagating one changes state
burden estimates by a median of 6.0% and by more
than 10% in 11 states, so the choice of source is
consequential for targeting. Third, a small group
of states is robustly identified as highest
priority while a comparable number cannot be
classified at all. Fourth, the evidence base does
not support ranking the recommended interventions,
and reporting that is more useful than producing a
ranking the evidence cannot bear.
What the
data can and cannot show
The gap between
recorded and modelled counts plausibly reflects
incomplete registration together with age
categories that obscure the under-five band. Two
administrative changes would materially improve
monitoring: disaggregating the below-14 category
into under-5, 5-9 and 10-14 bands, and publishing
a state-by-age cross-tabulation for drowning. The
second would remove the principal identification
constraint in the model presented here, which
absorbs the paediatric share into the recording
ratio precisely because that cross-tabulation does
not exist.
The relationship
between registration completeness and the
recording ratio has a practical implication that
cuts against intuition. States that register
deaths well record proportionately more drowning
deaths relative to their estimated child burden.
Under-recording is therefore concentrated where
registration is weakest, which is also where
burden is highest, so uncorrected routine data
will systematically understate burden in precisely
the states that most need investment.
The projection
illustrates a general limitation of short series.
Seven years of extrapolation from ten annual
observations produces intervals wide enough to
accommodate very different futures, and the
headline probability moves substantially with an
assumption about trend persistence that the data
cannot inform. Reporting the conditional range
rather than a single number is the honest
presentation, and the policy-relevant conclusion,
that the target is unlikely to be met without
deliberate action, does not depend on resolving
the assumption.
Interpreting
the intervention findings
The finding that
eight of ten recommended interventions have no
identified controlled evaluation reporting an
effect on drowning mortality should not be read as
evidence that they do not work. Absence of
evaluation is not evidence of absence of effect.
It does mean that comparative-effectiveness claims
cannot presently be supported, and that a national
strategy adopting them would be doing so on
grounds of plausibility, cost and deliverability
rather than demonstrated mortality benefit.
Day care and basic
swimming and water-safety skills training are the
two interventions with moderate-certainty
evidence, and both were evaluated principally in
rural Bangladesh.(12,13) Their transferability to
India is a matter of judgement rather than
measurement. Day care has the stronger practical
case in India because delivery machinery already
exists in the national child-development network,
whereas swim training requires safe training water
and trained instructors that are scarce in most
states. That is an argument about feasibility, not
about relative effect size, and it is presented as
such.
The two
interventions with quantified estimates illustrate
the transferability problem directly. The pooled
estimate for barriers around water comes from
case-control studies of domestic swimming pools in
high-income countries, whereas Indian child
drowning occurs predominantly in open wells,
ponds, tanks and rivers.(14) The estimate for
mandatory life jackets comes from an uncontrolled
before-and-after study of recreational boating in
a single high-income jurisdiction with strong
enforcement capacity.(15) Neither transfers
numerically to the Indian setting, and treating
either as a common effect measure applicable to
Indian children would not be justified.
For the remaining
interventions the position is weaker still.
Bystander rescue and resuscitation is described in
a descriptive study of rescue reports without a
controlled estimate of its effect on drowning
mortality, and the rescues it documents frequently
placed the rescuer in danger.(16) An earlier
systematic review of interventions to prevent
drowning in children and adolescents reached the
same conclusion about the field as a whole,
finding few evaluations reporting mortality
outcomes.(17) The Bangladeshi work that anchors
the two moderate-certainty interventions was,
moreover, conducted where drowning accounts for a
far larger share of child deaths than it does in
India, which is part of why effect sizes estimated
there should not be transported as though they
were a common effect measure.(18)
Implications
for a national strategy
The results support
a strategy built around measurement first. A
costed national drowning prevention strategy would
benefit from age-disaggregated targets, reform of
the reporting categories described above, and
adoption of a small, explicitly uncertain priority
list rather than a long one presented with false
precision. The states identified here with high
probability are a defensible starting point; the
states that could not be classified are an
argument for better data rather than for
exclusion.
Because no Indian
state publishes a water-safety-specific
administrative indicator, no state can currently
demonstrate readiness to deliver such a strategy,
and no national body can monitor whether readiness
is improving. Establishing even a minimal set of
programme indicators would be a low-cost
precondition for everything else.
Strengths
and limitations
The analysis uses
only published measurements, combines two
independent sources rather than restating one,
propagates uncertainty from both model and
sampling into every reported classification, and
reports what the evidence base cannot support as
well as what it can.
Its limitations are
substantial. The two-source model is identified
through partial pooling and a single covariate
rather than through direct observation of the
paediatric share, because the required
cross-tabulation is not published; the recording
ratio consequently confounds age composition with
recording completeness. Delhi contributes through
one source only. The segmented model cannot
attribute the 2020 discontinuity to any cause. The
projection depends on an unidentified damping
assumption and its interval is wide; residual
divergent transitions (14 of 8,000 draws) warrant
caution in reading precise posterior probabilities
from it. The priority index measures general
child-health-system capacity, not
drowning-specific readiness, because no
drowning-specific indicator exists; it is a proxy,
and its boundary is sensitive to weighting.
Intervention effect estimates are drawn from other
settings, and the transferability discount is an
assumption applied uniformly rather than a
measurement. The contextual analysis is ecological
and exploratory. Estimates for small states remain
sensitive to denominator construction. Flood
exposure was not examined, because the state-wise
flood-prone-area figures in general circulation
trace to a national commission estimate made in
1980 that could not be verified against a
currently retrievable primary source; given that
monsoon flooding is a plausible driver of
paediatric drowning, the absence of a maintained,
citable state flood-exposure series is itself a
data gap worth closing.
Conclusion
India's paediatric
drowning burden fell substantially over 2014-2023,
but routine police records capture only about a
third of it, and under-recording concentrates in
the states with the weakest civil registration and
the highest burden. Combining sources rather than
relying on one changes state estimates materially
and should be standard for injury burden
estimation in India. A small group of states is
robustly identified as highest priority, and a
comparable group cannot be classified at all,
which is an argument for better data rather than
for confident targeting. Attainment of the 2030
halving target is unlikely but highly uncertain
under any plausible extrapolation. The evidence
base cannot presently rank the recommended
interventions; only supervised day care and basic
swimming and water-safety skills training separate
from the field, and they do not separate from each
other. A national strategy should therefore begin
with measurement, because without
age-disaggregated reporting, a state-by-age
cross-tabulation and a minimal set of programme
indicators, neither targeting nor evaluation is
possible.
Acknowledgements
The author thanks
the Institute for Health Metrics and Evaluation,
the World Health Organization, the National Crime
Records Bureau, the International Institute for
Population Sciences and the United Nations
Population Division for maintaining the public
data resources on which this analysis depends.
Declarations
Conflicts of
Interest: The author declares no
competing financial or non-financial interests.
Funding: No
specific funding was received for this work from
any agency in the public, commercial or
not-for-profit sectors.
Ethical
approval and informed consent: Not
applicable. The study used only publicly available
aggregated secondary data with no individual-level
or identifiable information; institutional review
board approval and informed consent were therefore
not required.
Data
availability: All source datasets are
publicly available: the Global Burden of Disease
Results Tool (Institute for Health Metrics and
Evaluation), Accidental Deaths and Suicides in
India 2023 (National Crime Records Bureau), the
National Family Health Survey-5 district factsheet
(International Institute for Population Sciences)
and World Population Prospects 2024 (United
Nations Population Division). Processed data files
and the analytic code that generated every result
are available from the author on request.
Use of
artificial intelligence: Generative
artificial-intelligence tools were used solely for
editorial and language refinement. No scientific
content, analysis, interpretation or conclusion
was generated by such tools. The author takes full
responsibility for the integrity and accuracy of
the work.
References
- World Health Organization. Global status
report on drowning prevention 2024. Geneva:
World Health Organization; 2024. Available from:
https://www.who.int/publications/i/item/9789240103962
[cited 2026 Sep 1].
- Institute for Health Metrics and Evaluation.
GBD Results: Global Burden of Disease Study 2023
[database]. Seattle (WA): Institute for Health
Metrics and Evaluation, University of
Washington. Available from: https://vizhub.healthdata.org/gbd-results/
[cited 2026 Sep 1].
- National Crime Records Bureau. Accidental
deaths and suicides in India 2023. New Delhi:
National Crime Records Bureau, Ministry of Home
Affairs, Government of India; 2025. Available
from: https://ncrb.gov.in/accidental-deaths-suicides-in-india-adsi.html
[cited 2026 Sep 1].
- Office of the Registrar General and Census
Commissioner, India. Sample registration system
(SRS)-cause of death in India 2022-2024. New
Delhi: Office of the Registrar General and
Census Commissioner, India; 2026. Available
from: https://censusindia.gov.in/census.website/data/SRSCOD
[cited 2026 Sep 1].
- von Elm E, Altman DG, Egger M, et al. The
Strengthening the Reporting of Observational
Studies in Epidemiology (STROBE) statement:
guidelines for reporting observational studies.
Lancet. 2007;370(9596):1453-7.
doi:10.1016/S0140-6736(07)61602-X
- International Institute for Population
Sciences, ICF. National family health survey
(NFHS-5), 2019-21: India. Mumbai: International
Institute for Population Sciences; 2021.
Available from:
https://dhsprogram.com/publications/publication-FR375-DHS-Final-Reports.cfm
[cited 2026 Sep 1].
- United Nations, Department of Economic and
Social Affairs, Population Division. World
population prospects 2024. New York: United
Nations; 2024. Available from: https://population.un.org/wpp/
[cited 2026 Sep 1].
- Gardner ES Jr, McKenzie E. Forecasting trends
in time series. Manage Sci. 1985;31(10):1237-46.
doi:10.1287/mnsc.31.10.1237
- Hwang CL, Yoon K. Multiple attribute decision
making: methods and applications - a
state-of-the-art survey. Berlin:
Springer-Verlag; 1981.
doi:10.1007/978-3-642-48318-9
- Abril-Pla O, Andreani V, Carroll C, et al.
PyMC: a modern, and comprehensive probabilistic
programming framework in Python. PeerJ
Comput Sci. 2023;9:e1516.
doi:10.7717/peerj-cs.1516
- Criel Y, Severijns P, Scheers H, et al. Basic
swimming or water safety skills training for
drowning prevention in children: an updated
systematic review. Front Public Health. 2025;13:1698353.
doi:10.3389/fpubh.2025.1698353
- Rahman F, Bose S, Linnan M, et al.
Cost-effectiveness of an injury and drowning
prevention program in Bangladesh. Pediatrics.
2012;130(6):e1621-8.
doi:10.1542/peds.2012-0757
- Alfonso YN, Hyder AA, Alonge O, et al.
Cost-effectiveness analysis of a large-scale
creche intervention to prevent child drowning in
rural Bangladesh. Inj Epidemiol. 2021;8(1):61.
doi:10.1186/s40621-021-00351-9
- Thompson DC, Rivara FP. Pool fencing for
preventing drowning of children. Cochrane
Database Syst Rev. 1998;(1):CD001047.
doi:10.1002/14651858.CD001047
- Bugeja L, Cassell E, Brodie LR, et al.
Effectiveness of the 2005 compulsory personal
flotation device (PFD) wearing regulations in
reducing drowning deaths among recreational
boaters in Victoria, Australia. Inj Prev.
2014;20(6):387-92.
doi:10.1136/injuryprev-2014-041169
- Venema AM, Groothoff JW, Bierens JJ. The role
of bystanders during rescue and resuscitation of
drowning victims. Resuscitation. 2010;81(4):434-9.
doi:10.1016/j.resuscitation.2010.01.005
- Wallis BA, Watt K, Franklin RC, et al.
Interventions associated with drowning
prevention in children and adolescents:
systematic literature review. Inj Prev.
2015;21(3):195-204.
doi:10.1136/injuryprev-2014-041216
- Rahman A, Mashreky SR, Chowdhury SM, et al.
Analysis of the childhood fatal drowning
situation in Bangladesh: exploring prevention
measures for low-income countries. Inj
Prev. 2009;15(2):75-9.
doi:10.1136/ip.2008.020123
Supplementary
Material
STROBE Checklist
|
Supplementary Table S1. STROBE
checklist for cross-sectional studies.
|
|
Item
|
Recommendation
|
Reported in
|
|
1 (a)
|
Indicate the study design with a commonly
used term in the title or abstract
|
Abstract, Methods
|
|
1 (b)
|
Provide in the abstract an informative
and balanced summary
|
Abstract
|
|
2
|
Explain the scientific background and
rationale
|
Introduction
|
|
3
|
State specific objectives, including any
prespecified hypotheses
|
Introduction
|
|
4
|
Present key elements of study design
early in the paper
|
Materials and Methods, Study design and
reporting
|
|
5
|
Describe the setting, locations, and
relevant dates
|
Materials and Methods, Data sources
|
|
6 (a)
|
Give the eligibility criteria, and the
sources and methods of selection of
participants
|
Materials and Methods, Data sources
|
|
7
|
Clearly define all outcomes, exposures,
predictors, potential confounders and
effect modifiers
|
Materials and Methods, Two-source burden
model; State priority index
|
|
8
|
For each variable of interest, give
sources of data and details of methods of
assessment
|
Materials and Methods, Data sources;
Child population denominators
|
|
9
|
Describe any efforts to address potential
sources of bias
|
Materials and Methods, Two-source burden
model; Results, State burden
|
|
10
|
Explain how the study size was arrived at
|
Materials and Methods, Data sources
|
|
11
|
Explain how quantitative variables were
handled in the analyses
|
Materials and Methods, Two-source burden
model; Trajectory and projection
|
|
12 (a)
|
Describe all statistical methods,
including those used to control for
confounding
|
Materials and Methods, Statistical
analysis; Contextual layers
|
|
12 (b)
|
Describe any methods used to examine
subgroups and interactions
|
Materials and Methods, State priority
index
|
|
12 (c)
|
Explain how missing data were addressed
|
Materials and Methods, Data sources;
Supplementary Material, Capacity
indicator selection and uncertainty
propagation
|
|
12 (d)
|
Describe analytical methods taking
account of sampling strategy
|
Materials and Methods, State priority
index; Supplementary Material, Capacity
indicator selection and uncertainty
propagation
|
|
12 (e)
|
Describe any sensitivity analyses
|
Materials and Methods, Trajectory and
projection; Results, Projection to 2030
|
|
13
|
Report numbers of units at each stage of
the study
|
Materials and Methods, Data sources;
Results, State burden
|
|
14
|
Give characteristics of study units and
information on exposures and confounders
|
Results, State burden; Table 1
|
|
15
|
Report numbers of outcome events or
summary measures
|
Results, National trajectory; Recorded
against modelled counts
|
|
16 (a)
|
Give unadjusted and, if applicable,
confounder-adjusted estimates and their
precision
|
Results, Contextual associations; Table
1, Table 2
|
|
16 (b)
|
Report category boundaries when
continuous variables were categorised
|
Materials and Methods, State priority
index
|
|
17
|
Report other analyses done, such as
sensitivity analyses
|
Results, Projection to 2030;
Supplementary Table S3
|
|
18
|
Summarise key results with reference to
study objectives
|
Discussion, Principal findings
|
|
19
|
Discuss limitations, taking into account
sources of potential bias or imprecision
|
Discussion, Strengths and limitations
|
|
20
|
Give a cautious overall interpretation of
results
|
Discussion; Conclusion
|
|
21
|
Discuss the generalisability of the study
results
|
Discussion, Interpreting the intervention
findings; Strengths and limitations
|
|
22
|
Give the source of funding and the role
of the funders
|
Author declarations, Funding
|
|
Section names refer to headings in
the main manuscript.
|
Capacity indicator selection and
uncertainty propagation
Five National Family Health Survey-5 indicators
were selected on conceptual relevance to
delivering a child drowning prevention programme
and on district-level completeness. The factsheet
suppresses estimates built on too few unweighted
cases, and three otherwise attractive indicators
fail on coverage: care-seeking for childhood acute
respiratory infection is 31% complete, full
immunisation 65% and pre-primary attendance 78%.
Retaining them would require imputing the states
they omit. All five retained indicators are
reported for every state in the survey, at 96%
district completeness or better. Pre-primary
attendance and full immunisation were used in a
specification sensitivity analysis restricted to
the states reporting them.
State means carry sampling uncertainty because
they aggregate a finite number of districts. That
uncertainty was obtained by resampling districts
within each state, and paired with independent
draws from the burden posterior, so that the
reported credible intervals and tier probabilities
carry both sources jointly.
Convergence diagnostics
|
Supplementary Table S2.
Convergence diagnostics for all Bayesian
models.
|
|
Model
|
Max R-hat
|
Min bulk ESS
|
Divergent transitions
|
|
Segmented regression, national rate
|
1.00
|
2100
|
0 / 8,000
|
|
Two-source state model
|
1.01
|
451
|
21 / 8,000
|
|
Single-source state model
|
1.00
|
3614
|
0 / 8,000
|
|
Structural time-series projection
|
1.00
|
730
|
14 / 8,000
|
|
Divergent transitions are reported
whether or not they are zero
|
Sensitivity of the 2030 projection
|
Supplementary Table S3.
Sensitivity of the 2030 projection.
|
|
Specification
|
Median 2030 rate
|
P(target missed)
|
Divergent transitions
|
|
Damping fixed at 0.00
|
4.49
|
1.000
|
14 / 8,000
|
|
Damping fixed at 0.50
|
4.21
|
0.991
|
14 / 8,000
|
|
Damping fixed at 0.85
|
3.47
|
0.833
|
14 / 8,000
|
|
Damping fixed at 1.00
|
2.79
|
0.653
|
14 / 8,000
|
|
Damping prior beta 6 2
|
-
|
0.885
|
14 / 8,000
|
|
Damping prior uniform 0 1
|
-
|
0.942
|
14 / 8,000
|
|
Damping prior beta 2 2
|
-
|
0.962
|
14 / 8,000
|
|
Variance prior, primary scales
|
3.84
|
0.897
|
247 / 4,000
|
|
Variance prior, looser scales
|
3.44
|
0.760
|
923 / 4,000
|
|
Variance prior, tighter scales
|
3.90
|
0.941
|
70 / 4,000
|
|
The three variance-prior rows are
separate refits with 4,000 draws at a
target acceptance rate of 0.95. The
primary projection used 8,000 draws at
0.999, so the primary-scales row (0.897;
247 divergent transitions) differs
slightly from the primary result
reported in the text (0.885; 14
divergent transitions).
|
Evidence provenance for each intervention
|
Supplementary Table S4. Evidence
provenance for each intervention.
|
|
Intervention
|
Certainty
|
Evidence basis
|
Source
|
Transferability
|
|
Day care
|
Moderate
|
Large observational cohort of the Anchal
creche component of the PRECISE programme;
the WHO guideline issues a strong
recommendation for day-care provision in
high-burden low- and middle-income
settings. No pooled quantitative estimate
is published for the creche component
alone.
|
World Health Organization. WHO guideline
on the prevention of drowning through
provision of day-care and basic swimming
and water safety skills training. Geneva:
WHO; 2021.
|
Rural Bangladesh delivery model. India
has an existing national anganwadi network
through which day care is already
delivered, so the delivery machinery
exists even though the effect estimate
does not transfer numerically.
|
|
Swim training
|
Moderate
|
SwimSafe evaluated against matched
non-participants showed a statistically
significant reduction in drowning death
risk in children aged 4-12 years (moderate
certainty). The 2025 updated systematic
review found heterogeneity across
populations, interventions and outcomes
too large to pool, so no meta-analytic
effect estimate exists.
|
Criel Y, Severijns P, Scheers H, et al.
Basic swimming or water safety skills
training for drowning prevention in
children: an updated systematic review.
Front Public Health. 2025;13:1698353.
|
Bangladesh riverine setting. Requires
safe training water and trained
instructors, both scarce in most Indian
states.
|
|
Fencing
|
Low
|
Cochrane review of three case-control
studies: odds ratio for drowning or
near-drowning in a fenced versus unfenced
pool 0.27 (95% CI 0.16 to 0.47).
Relative-risk reduction derived as one
minus the odds ratio and its interval.
|
Thompson DC, Rivara FP. Pool fencing for
preventing drowning of children. Cochrane
Database Syst Rev. 1998;(1):CD001047.
|
Estimated for domestic swimming pools in
high-income countries. Indian paediatric
drowning occurs predominantly in open
wells, ponds, tanks and rivers, for which
no fencing effect estimate exists.
Numerical transfer is not supported.
|
|
Life jackets
|
Low
|
Uncontrolled before-and-after study of
the 2005 Victorian compulsory
personal-flotation-device regulations: 59
recreational-boating drowning deaths in
the 6 years before versus 16 in the 5
years after. Rate ratio and interval
computed from these counts assuming
Poisson variation, with no adjustment for
secular trend or exposure change.
|
Bugeja L, Cassell E, Brodie LR, et al.
Effectiveness of the 2005 compulsory
personal flotation device (PFD) wearing
regulations in reducing drowning deaths
among recreational boaters in Victoria,
Australia. Inj Prev. 2014;20(6):387-92.
|
Recreational boating in a high-income
jurisdiction with strong enforcement
capacity. Indian inland water transport is
largely commercial and subsistence, and
enforcement capacity differs
substantially.
|
|
Bystander CPR
|
Very low
|
Descriptive study of rescue reports on
bystander
involvement in drowning rescue and
resuscitation. Reports no controlled
effect estimate for drowning mortality.
|
Venema AM, Groothoff JW, Bierens JJ. The
role of bystanders during rescue and
resuscitation of drowning victims.
Resuscitation. 2010;81(4):434-9.
|
Rescues
frequently took place in dangerous
circumstances
for the rescuer, which is of particular
concern where swimming competence is low.
|
|
Safer boating
|
Very low
|
No controlled evaluation identified
reporting a drowning-mortality effect
estimate for boating safety standards in a
paediatric population.
|
|
Regulatory instrument whose effect
depends entirely on enforcement capacity,
which is not measured at state level in
India.
|
|
Flood warning
|
Very low
|
No controlled evaluation identified
reporting a paediatric drowning-mortality
effect estimate for flood early-warning
systems.
|
|
India operates national flood forecasting
through the Central Water Commission, so
delivery infrastructure exists, but no
paediatric drowning effect has been
quantified.
|
|
School curriculum
|
Very low
|
No controlled evaluation identified
reporting a drowning-mortality effect
estimate for curricular water-safety
education as distinct from skills
training.
|
|
Deliverable through existing school
health architecture, but evidence of a
mortality benefit is absent.
|
|
Media campaigns
|
Very low
|
No controlled evaluation identified
reporting a drowning-mortality effect
estimate for mass-media water-safety
campaigns.
|
|
Low unit cost and national reach through
established public broadcasting, but no
published estimate of an effect on
drowning mortality in any setting.
|
|
Resilient infrastructure
|
Very low
|
No controlled evaluation identified
reporting a paediatric drowning-mortality
effect estimate for flood-resilient
infrastructure.
|
|
Very high capital cost and long lead
time, with benefits that are broad but not
drowning-specific.
|
Contextual associations
|
Supplementary Table S5.
Contextual associations, unadjusted and
adjusted.
|
|
Layer
|
n
|
Spearman rho
|
p
|
Partial rho
|
Partial p
|
|
female_literacy_pct
|
30
|
-0.678
|
0.0000
|
-0.623
|
0.0002
|
|
clean_fuel_pct
|
30
|
-0.479
|
0.0075
|
-0.198
|
0.2937
|
|
development_index
|
30
|
-0.450
|
0.0126
|
-
|
-
|
|
electricity_pct
|
30
|
-0.410
|
0.0244
|
-0.072
|
0.7069
|
|
improved_water_pct
|
30
|
-0.140
|
0.4608
|
0.171
|
0.3665
|
|
under15_share_pct
|
30
|
0.343
|
0.0633
|
-0.059
|
0.7552
|
|
child_marriage_pct
|
30
|
0.596
|
0.0005
|
0.516
|
0.0035
|
|
Partial correlations adjust for a
composite state development index.
Ecological and exploratory; no causal
inference is supported.
|
Supplementary figures
|
| Supplementary
Figure S1: Rank acceptability of ten
recommended drowning prevention
interventions. Left panel: median rank
with 95% uncertainty interval. Right
panel: probability of ranking in the top
three. Colour denotes certainty of
evidence. |
|
| Supplementary Figure S2:
Contextual associations with state
paediatric drowning burden, before and
after adjustment for a composite state
development index. |
|


