|
Introduction
Civil
registration and vital statistics systems are the
only continuous source of individual-level birth
and death data, and their completeness determines
whether a country can measure its own
mortality.(1,2) Where registration is incomplete,
mortality estimates depend on sample surveys and
modelling rather than on counted events, and
subnational planning suffers most.(3)
India operates a
statutory Civil Registration System under the
Registration of Births and Deaths Act.(4) Its
birth registration has improved markedly, but
death registration has lagged, and completeness
varies widely between states.(5,6) Several
assessments conclude that the system is
approaching usability for subnational mortality
estimation in some states while remaining far from
it in others.(7-9) The COVID-19 pandemic exposed
the consequences directly, when incomplete routine
death surveillance made excess mortality difficult
to quantify.(10,11)
Attention has
concentrated on births. Determinants of birth
registration in India are well described, and the
expansion of institutional delivery is widely
credited with driving improvement, because a
facility birth creates a documentary event that
can be notified.(12,13) International work
similarly treats the facility birth as the natural
point of capture for registration.(14-16)
Whether that same
health-system contact improves death registration
has not been tested at district level. The
question matters because the policy inference
differs sharply. If facility contact raises both,
then expanding service coverage will close the gap
in time. If it raises only birth registration,
then death certification requires a separate
intervention, and continued investment in delivery
capacity will not help.
Two features of the
Indian evidence base make a district-level
analysis necessary. First, state averages conceal
large internal variation in health-system
performance.(17) Second, an association observed
across all districts may reflect state context
rather than any district-level mechanism, and only
a within-state comparison can separate them.(18)
This analysis
describes the birth-minus-death registration gap
across 705 Indian districts and identifies its
correlates. It then tests whether those correlates
survive a comparison of districts inside the same
state, and locates the districts where the two
registration systems are most discordant.
Material and Methods
Study
design and data source
We conducted an
ecological cross-sectional analysis of publicly
available aggregated district-level data from the
National Family Health Survey-5, conducted in
India during 2019-21.(19) District factsheet
indicators were compiled into a numeric analytical
file. Reporting follows the Strengthening the
Reporting of Observational Studies in Epidemiology
statement for cross-sectional studies.(20)
Analytical
units
The analytical panel
comprised 705 districts across 36 states and union
territories with complete data on all study
indicators. A district listed as "Chandel" under
Mizoram in the source file is a known listing
error, Chandel being a district of Manipur, and
was excluded; the exclusion was re-verified during
analysis. Three state names carrying source
misspellings or non-standard forms were corrected
for display only, with no value altered and no
unit merged.
Measures
and their denominators
The two registration
indicators do not share a denominator or a
reference period, and this is carried explicitly
through the analysis rather than assumed away.
Birth registration is the percentage of children
under five years whose birth was registered with
the civil authority, measured among surviving
children over a five-year window. Death
registration is the percentage of deaths in the
household during the last three years that were
registered, measured over a three-year window
among decedents who are predominantly older
adults. Their arithmetic difference, the
registration gap, is therefore a descriptive
contrast between two completeness measures rather
than a single coherent estimand, and is
interpreted as such throughout.
Five district
correlates were used: women aged 15-49 with ten or
more years of schooling; population living in
households with improved sanitation; households
using clean cooking fuel; households with any
member covered by health insurance or a financing
scheme; and institutional births in the five years
before the survey. Each is a percentage. All were
standardised, so coefficients express the
difference in an outcome per one standard
deviation higher indicator.
Statistical
analysis
Models were weighted
by the number of households surveyed in each
district. This is a precision weight reflecting
the sampling effort behind each district estimate;
because district samples are of broadly similar
size, weighting does not make the estimates
population-representative, and an unweighted
sensitivity analysis is reported. Variance was
clustered at the state or union territory.
Two model families
were fitted for each of the three outcomes. The
first regressed the outcome on all five correlates
across all districts, so that comparisons span
state boundaries. The second added state fixed
effects, restricting comparison to districts
within the same state. A correlate that holds in
the first but disappears in the second is a marker
of state context rather than a district-level
lever. Because 30 correlate-outcome tests were
performed across the two model families, P values
were corrected together using the
Benjamini-Hochberg false discovery rate, and q
values below 0.05 were treated as surviving
correction.(21)
Inference was
strengthened in four ways, because 36 clusters is
few enough that the cluster-robust sandwich is
known to reject too often. First, p values for the
principal contrast were recomputed by wild cluster
bootstrap with 4,999 Rademacher draws and the null
imposed. Second, because both registration
outcomes are bounded percentages, models were
refitted as fractional (quasi-binomial) logits and
reported as average marginal effects on the
percentage-point scale. Third, each model was
refitted 36 times, omitting one state at a time.
Fourth, Huber M-estimation was used to check that
influential districts do not drive the linear
estimates.
To distinguish a
genuine loss of association from ordinary
regression dilution, the change between the two
specifications was tested for every predictor,
treating the estimates as independent, which is
conservative because they share data. Generic
dilution would shrink all predictors; a
predictor-specific pattern would not.
We decomposed the
variance in each outcome into a between-state and
a within-state component using the coefficient of
determination of a model containing state
indicators alone. Districts were classified into
four groups by birth registration of 90% or more
and death registration of 70% or more, and the
concentration of the death-registration shortfall
across districts and states was quantified.
Because the published district estimates carry no
standard errors, the sensitivity of that
classification was assessed by moving both
thresholds and by counting districts lying within
five percentage points of either boundary.
Analyses used Python 3.14 with pandas, statsmodels
and SciPy; all result files are generated directly
by the analysis script without manual editing.
Ethical
approval
Not applicable. The
study used only publicly available aggregated
secondary data with no individual-level or
identifiable information, so institutional review
and informed consent were not required.
Results
Registration
levels and the gap
Across 705
districts, median birth registration was 94.9% and
median death registration 76.2%, giving a median
registration gap of 17.1 percentage points and a
mean of 19.8 (Table 1). Death registration was far
more variable than birth registration, ranging
from 8.3% to 100% with a standard deviation of
21.0 points, against 51.6% to 100% and a standard
deviation of 9.4 points for births. Death
registration fell below 70% in 279 districts and
below 50% in 137 districts. The gap was negative,
meaning deaths were better registered than births,
in 23 districts, 3.3% of the total (Figure 1).
|
Table 1: District-level
indicators, 705 districts, National
Family Health Survey-5, India, 2019-21.
|
|
Indicator
|
Denominator and reference period
|
Districts
|
Mean
|
SD
|
Minimum
|
Median
|
Maximum
|
|
Birth registration (%)
|
Children under age 5 whose birth was
registered, surviving children, 5-year
window
|
705
|
91.1
|
9.4
|
51.6
|
94.9
|
100.0
|
|
Death registration (%)
|
Deaths in the household in the last 3
years that were registered, 3-year window
|
705
|
71.2
|
21.0
|
8.3
|
76.2
|
100.0
|
|
Birth-minus-death registration gap
(percentage points)
|
Difference between the two measures
above; denominators and windows differ
|
705
|
19.8
|
15.1
|
-7.0
|
17.1
|
85.1
|
|
Institutional births (%)
|
Births in the 5 years before the survey
|
705
|
88.7
|
12.0
|
21.4
|
92.2
|
100.0
|
|
Women with 10+ years of schooling (%)
|
Women aged 15-49
|
705
|
40.3
|
14.2
|
13.6
|
39.2
|
88.2
|
|
Improved sanitation facility (%)
|
Population living in such households
|
705
|
71.9
|
14.3
|
29.2
|
73.7
|
99.9
|
|
Clean cooking fuel (%)
|
Households
|
705
|
54.1
|
24.2
|
8.6
|
50.4
|
99.8
|
|
Any health insurance cover (%)
|
Households with any usual member covered
|
705
|
40.2
|
23.1
|
1.2
|
35.7
|
97.8
|
|
SD: standard deviation. The two
registration indicators differ in
denominator and reference period, as
shown; their difference is a descriptive
contrast rather than a difference in a
common quantity.
|
The shortfall was
concentrated. The worst decile of districts
accounted for 24.4% of the total national
death-registration deficit and the worst quartile
for 51.7%. Five states, Uttar Pradesh, Bihar,
Jharkhand, Arunachal Pradesh and Madhya Pradesh,
together accounted for 50.5% of the deficit.
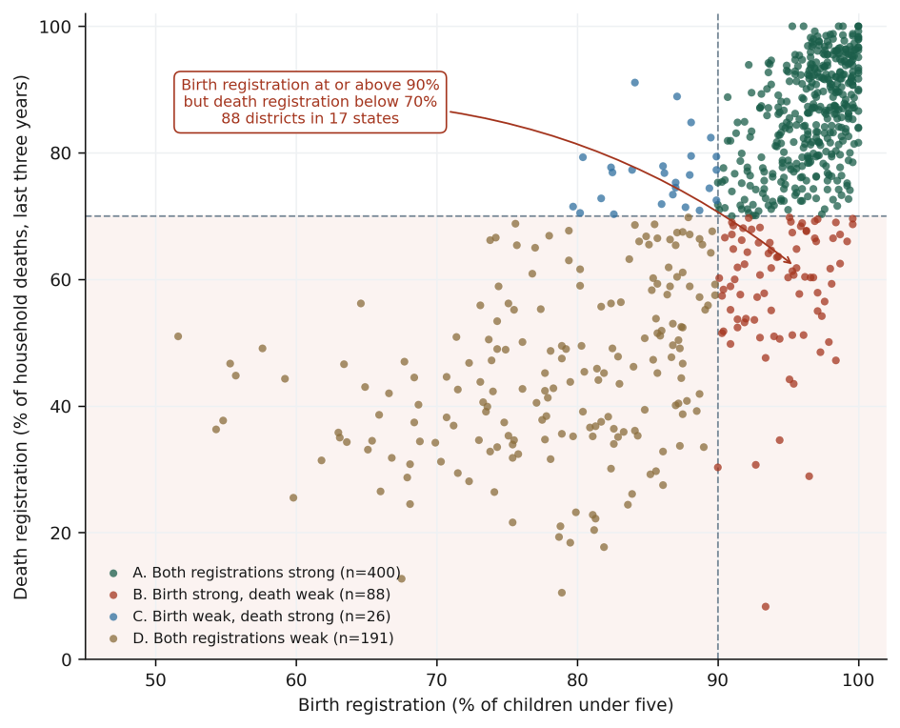
|
| Figure
1: Birth registration against
death registration, 705 Indian districts,
National Family Health Survey-5. Each
point is one district. Dashed lines mark
birth registration of 90% and death
registration of 70%. The shaded band
identifies districts registering fewer
than seven in ten deaths. Colours denote
the four registration groups defined in
Table 4. |
Correlates
across districts
Across all
districts, institutional births showed the
strongest association with both outcomes (Table
2). Each standard deviation higher coverage went
with 5.05 percentage points higher birth
registration (95% confidence interval 3.61 to
6.50) and 9.13 points higher death registration
(6.77 to 11.49). Both survived correction for
multiple testing. Improved sanitation was
associated with higher birth registration (2.51;
0.88 to 4.13) and higher death registration (4.54;
0.94 to 8.13). Women's schooling, clean cooking
fuel and health insurance showed no association
that survived correction. Four of the 30 tests
across both model families survived the false
discovery rate procedure at this stage, with three
more surviving in the within-state models reported
below.
|
Table 2: Adjusted associations of
district indicators with registration
outcomes across all 705 districts.
|
|
Outcome
|
District indicator
|
Adjusted difference per 1 SD (95%
CI)
|
P
|
q
|
Districts
|
|
Birth registration
|
Women with 10 or more years of schooling
|
-0.15 (-1.71 to 1.41)
|
0.854
|
0.915
|
705
|
|
Birth registration
|
Improved sanitation facility
|
2.51 (0.88 to 4.13)
|
0.003
|
0.015
|
705
|
|
Birth registration
|
Clean cooking fuel
|
-0.12 (-2.13 to 1.88)
|
0.906
|
0.937
|
705
|
|
Birth registration
|
Any health insurance cover
|
1.29 (-1.11 to 3.68)
|
0.292
|
0.382
|
705
|
|
Birth registration
|
Institutional births
|
5.05 (3.61 to 6.50)
|
<0.001
|
0.001
|
705
|
|
Death registration
|
Women with 10 or more years of schooling
|
1.06 (-3.09 to 5.21)
|
0.616
|
0.711
|
705
|
|
Death registration
|
Improved sanitation facility
|
4.54 (0.94 to 8.13)
|
0.013
|
0.050
|
705
|
|
Death registration
|
Clean cooking fuel
|
3.16 (-1.56 to 7.88)
|
0.189
|
0.258
|
705
|
|
Death registration
|
Any health insurance cover
|
3.91 (-0.51 to 8.34)
|
0.083
|
0.139
|
705
|
|
Death registration
|
Institutional births
|
9.13 (6.77 to 11.49)
|
<0.001
|
0.001
|
705
|
|
Birth-minus-death registration gap
|
Women with 10 or more years of schooling
|
-1.21 (-4.39 to 1.97)
|
0.456
|
0.548
|
705
|
|
Birth-minus-death registration gap
|
Improved sanitation facility
|
-2.03 (-5.06 to 1.00)
|
0.188
|
0.258
|
705
|
|
Birth-minus-death registration gap
|
Clean cooking fuel
|
-3.28 (-6.31 to -0.25)
|
0.034
|
0.073
|
705
|
|
Birth-minus-death registration gap
|
Any health insurance cover
|
-2.63 (-5.12 to -0.14)
|
0.038
|
0.076
|
705
|
|
Birth-minus-death registration gap
|
Institutional births
|
-4.08 (-5.96 to -2.20)
|
<0.001
|
0.001
|
705
|
|
CI: confidence interval; SD: standard
deviation. Linear models weighted by the
number of households surveyed, with
variance clustered at the state or union
territory, containing all five indicators
simultaneously. q is the
Benjamini-Hochberg false discovery rate
computed jointly across all 30 tests in
Tables 2 and 3.
|
Because
institutional births were more strongly associated
with death registration than with birth
registration, they were associated with a narrower
gap across districts (-4.08 points per standard
deviation; -5.96 to -2.20).
The
association reverses within states
Adding state fixed
effects changed the picture (Table 3, Figure 2).
The association between institutional births and
death registration disappeared entirely, from 9.13
points per standard deviation across districts to
-0.06 (-2.13 to 2.02; P=0.959) within states, an
attenuation of essentially the whole effect. The
association with birth registration attenuated but
persisted (5.05 to 2.87; 0.39 to 5.35; P=0.023).
|
Table 3: Comparison of
associations estimated across all
districts and within states.
|
|
Outcome
|
District indicator
|
Across all districts (95% CI)
|
Within states (95% CI)
|
Within-state P
|
|
Birth registration
|
Women with 10 or more years of schooling
|
-0.15 (-1.71 to 1.41)
|
0.39 (-0.49 to 1.27)
|
0.382
|
|
Birth registration
|
Improved sanitation facility
|
2.51 (0.88 to 4.13)
|
0.73 (-0.27 to 1.73)
|
0.154
|
|
Birth registration
|
Clean cooking fuel
|
-0.12 (-2.13 to 1.88)
|
-0.22 (-1.28 to 0.84)
|
0.683
|
|
Birth registration
|
Any health insurance cover
|
1.29 (-1.11 to 3.68)
|
1.58 (0.24 to 2.92)
|
0.020
|
|
Birth registration
|
Institutional births
|
5.05 (3.61 to 6.50)
|
2.87 (0.39 to 5.35)
|
0.023
|
|
Death registration
|
Women with 10 or more years of schooling
|
1.06 (-3.09 to 5.21)
|
1.75 (-0.05 to 3.55)
|
0.056
|
|
Death registration
|
Improved sanitation facility
|
4.54 (0.94 to 8.13)
|
3.31 (1.43 to 5.19)
|
<0.001
|
|
Death registration
|
Clean cooking fuel
|
3.16 (-1.56 to 7.88)
|
2.45 (0.19 to 4.70)
|
0.034
|
|
Death registration
|
Any health insurance cover
|
3.91 (-0.51 to 8.34)
|
5.26 (0.72 to 9.80)
|
0.023
|
|
Death registration
|
Institutional births
|
9.13 (6.77 to 11.49)
|
-0.06 (-2.13 to 2.02)
|
0.959
|
|
Birth-minus-death registration gap
|
Women with 10 or more years of schooling
|
-1.21 (-4.39 to 1.97)
|
-1.36 (-3.07 to 0.35)
|
0.119
|
|
Birth-minus-death registration gap
|
Improved sanitation facility
|
-2.03 (-5.06 to 1.00)
|
-2.58 (-4.67 to -0.49)
|
0.016
|
|
Birth-minus-death registration gap
|
Clean cooking fuel
|
-3.28 (-6.31 to -0.25)
|
-2.67 (-4.56 to -0.77)
|
0.006
|
|
Birth-minus-death registration gap
|
Any health insurance cover
|
-2.63 (-5.12 to -0.14)
|
-3.68 (-7.62 to 0.26)
|
0.067
|
|
Birth-minus-death registration gap
|
Institutional births
|
-4.08 (-5.96 to -2.20)
|
2.93 (0.87 to 4.98)
|
0.005
|
|
CI: confidence interval; SD: standard
deviation. Both columns are percentage
points per one standard deviation higher
indicator. The within-state column adds
state fixed effects, so comparison is
restricted to districts of the same state.
Institutional births lose their
association with death registration
entirely, and their association with the
gap reverses sign.
|
Consequently the gap
association reversed sign. Across districts,
higher institutional births went with a narrower
gap; within a state, districts with more
institutional births had a wider gap (2.93 points
per standard deviation; 0.87 to 4.98; P=0.005).
Health insurance and clean cooking fuel, by
contrast, retained or strengthened their
association with death registration within states.
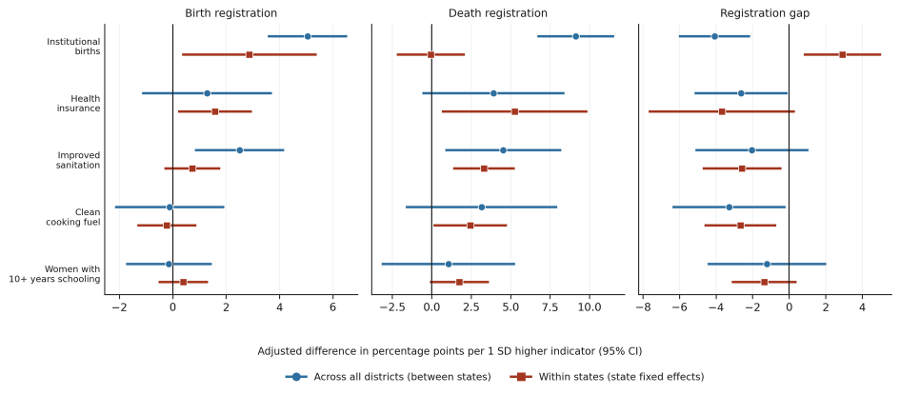
|
| Figure
2: Adjusted associations of
five district indicators with birth
registration, death registration and the
registration gap, comparing estimates
across all districts with estimates within
states. Circles are models spanning all
705 districts; squares are models with
state fixed effects. Bars are 95%
confidence intervals. Coefficients are
percentage points per one standard
deviation higher indicator. The
association between institutional births
and death registration disappears within
states. |
Three features rule
out ordinary regression dilution as the
explanation. First, the attenuation was specific
rather than general: institutional births lost
100.6% of their association with death
registration, whereas the other four predictors of
the same outcome changed by a median of -5.9%,
that is, on balance they did not shrink, and no
individual change was significant (all P≥0.55;
Table S6). Second, the difference between the
between-district and within-state estimates for
institutional births was itself significant (P=1.0
x 10-8) on a conservative test. Third,
every alternative method reproduced the reversal.
A wild cluster bootstrap with 4,999 draws gave
P=0.96 within states against P=0.0002 across
districts. A fractional logit, which respects the
bounds of a percentage outcome, gave an average
marginal effect of -0.55 points within states
against 7.47 across districts. Huber M-estimation
gave 0.18 against 9.77. Omitting each state in
turn produced within-state estimates from -0.55 to
0.69, crossing zero, against a stable 8.56 to 9.52
across districts.
Variance
decomposition explained why. Death registration
was 82.3% a between-state phenomenon and only
17.7% within-state, whereas birth registration was
69.6% between-state and the gap 67.5%. Death
registration is therefore predominantly determined
at the level of the state system, though about a
third of the variation in the gap still lies
between districts of the same state.
Districts
where registration systems are most discordant
Classifying
districts on both indicators produced four groups
(Table 4). Four hundred districts registered both
well. One hundred and ninety-one registered both
poorly, with mean birth registration 78.3% and
mean death registration 44.8%. Twenty-six combined
birth registration below 90% with death
registration of 70% or more.
|
Table 4: District registration
groups defined by birth registration of
90% or more and death registration of
70% or more.
|
|
Registration group
|
Districts
|
Birth registration (%)
|
Death registration (%)
|
Gap (points)
|
Institutional births (%)
|
Health insurance (%)
|
Women with 10+ years schooling
(%)
|
|
A. Both registrations strong
|
400
|
96.7
|
86.2
|
10.5
|
94.0
|
44.2
|
44.8
|
|
B. Birth strong, death weak
|
88
|
94.3
|
58.6
|
35.8
|
87.7
|
42.9
|
35.6
|
|
C. Birth weak, death strong
|
26
|
85.9
|
76.7
|
9.1
|
89.7
|
48.6
|
35.8
|
|
D. Both registrations weak
|
191
|
78.3
|
44.8
|
33.5
|
78.0
|
29.5
|
33.7
|
|
Values are unweighted district means.
Group B is the priority group discussed in
the text: registration systems already
capture most births, and institutional
birth coverage is close to average, yet
fewer than seven deaths in ten are
registered.
|
The remaining 88
districts, spread across 17 states, combined birth
registration of 90% or more with death
registration below 70% (Figure 3). Their mean
birth registration was 94.3% and mean death
registration 58.6%, a mean gap of 35.8 points.
Critically, their mean institutional birth
coverage was 87.7%, close to the national picture.
Among the 417 districts where institutional births
reached 90% or more, mean birth registration was
95.2% but mean death registration only 81.5%. Of
the 88 districts, Assam contributed 21 such
districts, Arunachal Pradesh 11, and Madhya
Pradesh and Uttar Pradesh nine each.
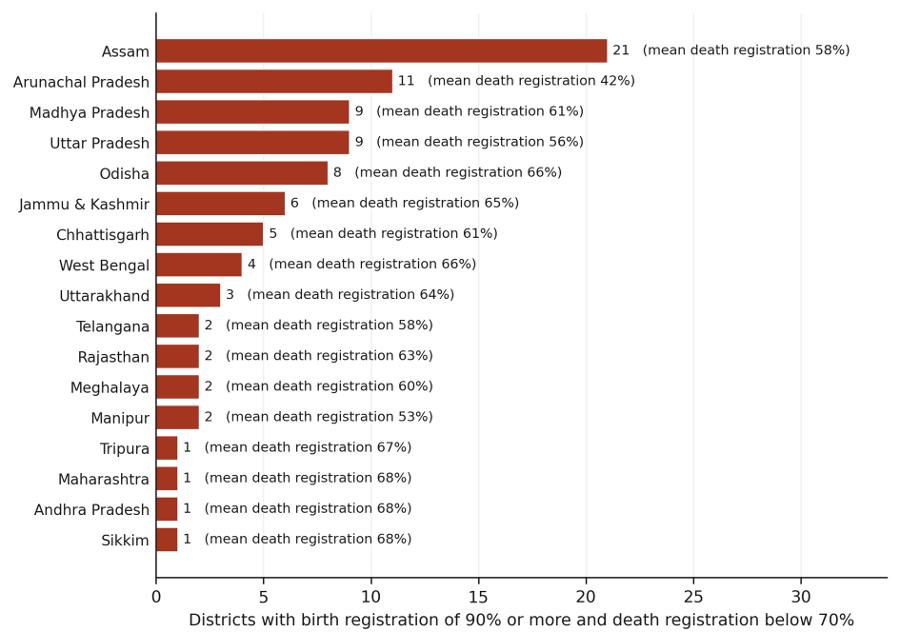
|
| Figure
3: States containing districts
with birth registration of 90% or more and
death registration below 70%. Bars show
the number of such districts per state;
annotations give the mean death
registration in those districts.
Eighty-eight districts across 17 states
meet both criteria. |
This grouping is a
planning device rather than a precise list. Moving
the thresholds by five percentage points changed
the group size from 41 to 142 districts, and 264
districts lie within five points of one boundary
or the other. Individual district membership
should therefore be treated as indicative,
although the existence of a substantial group
registering most births and few deaths is not
sensitive to the cut-points.
Sensitivity
analyses
Unweighted models
produced closely similar estimates, indicating
that the precision weighting did not drive the
findings. The wild cluster bootstrap, fractional
logit, leave-one-state-out and Huber estimates are
reported in full in the supplementary file, and
all reproduce the pattern described above.
Discussion
Across 705 Indian
districts, birth registration exceeded death
registration by a median 17 percentage points, and
the shortfall was concentrated in a minority of
districts and a handful of states. The central
finding, however, is not the size of the gap but
its mechanism. Institutional birth coverage, the
strongest apparent correlate of death registration
across the country, carried no association once
districts were compared within their own state.
Facility contact tracks birth registration; it
does not track death registration. Because the
design is cross-sectional and ecological, this is
an association rather than a demonstrated
mechanism, but the pattern is consistent across
every estimator applied.
This distinction is
easy to miss and consequential. A cross-sectional
analysis that pools districts across states
recovers a strong positive association between
institutional births and death registration, which
invites the conclusion that strengthening delivery
services will improve mortality statistics. The
within-state comparison shows that this
association is carried by state context: states
that have built delivery capacity have also,
separately, built registration administration.
Inside any one state, a district with more
facility births registers no more deaths than its
neighbour, and in fact shows a wider birth-death
gap because facility contact lifts one side of the
ledger only.
Alternative
explanations deserve consideration. Districts with
more institutional births are, within a state,
likely to be more urban, and urban death
registration faces its own barriers, including
deaths among migrants and in private facilities
that may not be notified locally. Differential
measurement error is a second possibility, since
district death-registration estimates rest on
relatively few household deaths and are noisier
than birth estimates. Neither explanation accounts
for the specificity of the finding. Ordinary noise
would attenuate every predictor. Yet the other
four correlates of death registration showed no
significant attenuation, and the change for
institutional births was large and highly
significant.
The most economical
explanation is structural. A facility birth
generates an institutional record, a notification
pathway and an administrative actor with an
incentive to report.(13,14) Most deaths in India
occur at home, outside any facility record, and
the medical certification of cause of death
applies chiefly to institutional deaths. Even
where certification is required, its completeness
and quality are known to be poor, and studies from
tertiary hospitals repeatedly find substantial
error rates that respond to targeted
training.(22-25) Certification difficulties were
amplified during the pandemic.(26) The consequence
for national statistics is that a large share of
deaths reaching the system carries uninformative
cause codes.(27) Structured district-level
programmes to strengthen cause-of-death statistics
are being trialled precisely because the routine
pathway does not deliver.(28)
Our findings align
with, and extend, the established literature.
Assessments of the Civil Registration System have
documented improving but uneven death registration
and persistent inter-state inequality.(5,6)
Analyses of birth registration determinants have
emphasised institutional delivery.(12) Recent work
has shown that female deaths are particularly
under-registered, indicating that the shortfall is
not merely geographic but also social.(29) Surveys
themselves undercount some vital events, as
demonstrated for stillbirths in both the Sample
Registration System and the National Family Health
Survey, which is a reminder that no single source
is complete.(30) The concentration of the deficit
in a few large states echoes the geography of
other district-level health inequalities and of
programme coverage such as the Janani Suraksha
Yojana.(17,31) That the Aspirational Districts
Programme has been evaluated using the same survey
underlines that district-level targeting is an
established policy instrument in India.(32)
Implications
for policy and practice
Four implications
follow. First, death registration should be
monitored and targeted as a distinct indicator,
not assumed to follow health-service expansion.
The variance decomposition indicates that
state-level administrative reform is the dominant
lever, but a third of the variation in the gap
lies between districts of the same state, so
district action is not futile.
Second, the 88
districts identified here are an immediately
actionable list. They already register nine in ten
births and have near-average institutional
delivery coverage, meaning the administrative
apparatus and the health-system contact both
exist. What is missing is the death-side workflow.
These are the districts where an intervention has
the best prior odds of success.
Third, because most
deaths occur at home, the intervention cannot be
facility-centred. It requires community-level
notification by frontline workers, simplified
reporting for non-institutional deaths, and
linkage between the health system and the
registrar.
Fourth, for
clinicians, medical certification of cause of
death is a professional duty rather than a
clerical formality, and the evidence indicates
that its quality improves with brief, targeted
training.(24,25) Incorporating certification into
undergraduate and internship teaching is a
low-cost contribution to national mortality
statistics.
Strengths
and limitations
Strengths include
national district-level coverage, explicit
handling of the differing denominators of the two
registration indicators, separation of
between-state from within-state variation,
correction for multiple testing, and a fully
scripted and reproducible analysis.
The limitations are
substantial. The design is ecological and
cross-sectional; associations between district
aggregates need not hold for individuals, and no
causal claim is made.(18) Both registration
indicators are self-reported by households rather
than drawn from the registration system itself, so
they measure reported registration and may
misclassify. The two indicators differ in
denominator, reference period and age structure,
so the gap is a contrast and not a difference in a
common quantity. Household deaths in the preceding
three years are relatively rare events, so
district death-registration estimates carry more
sampling error than birth estimates, which may
attenuate within-state associations. Weighting by
households surveyed is a precision weight and does
not confer population representativeness. Only
five district correlates were available from the
factsheet, and administrative variables such as
registrar density or distance to a registration
office, which are plausibly the operative factors,
were not observable. Finally, the survey was
fielded in 2019-21, overlapping the onset of the
COVID-19 pandemic.
Conclusion
Birth registration
exceeded death registration by a median 17
percentage points across 705 Indian districts,
with death registration below 70% in 279
districts. Institutional birth coverage predicted
death registration across the country but not
within states, showing that health-facility
contact converts into birth registration alone.
Eighty-eight districts already register most
births yet register fewer than seven in ten
deaths, and constitute a defined target for a
death-side registration intervention.
Acknowledgements
The author
acknowledges the International Institute for
Population Sciences and ICF for conducting the
National Family Health Survey and making district
factsheet data publicly available.
Declarations
Author contributions (CRediT): S
H S - conceptualisation, methodology, software,
formal analysis, data curation, investigation,
visualisation, writing - original draft, writing -
review and editing.
Conflicts of interest: The
author declares no competing financial or
non-financial interests.
Funding: No specific funding was
received for this work from any agency in the
public, commercial or not-for-profit sectors.
Ethical approval and informed consent:
Not applicable. The study used only publicly
available aggregated secondary data with no
individual-level or identifiable information;
institutional review and informed consent were not
required.
Reporting guideline: The study
is reported in accordance with the STROBE
statement for cross-sectional observational
studies. The completed STROBE checklist is
provided as a supplementary file.
Data availability: All source
data are publicly available from the National
Family Health Survey-5 district factsheets. The
derived analytical file, the complete analysis
code and all result tables are available from the
corresponding author on reasonable request.
Use of artificial intelligence:
Generative artificial-intelligence tools were used
to assist with literature retrieval, analysis code
drafting and language editing. The author verified
all data, analyses, results and interpretations,
and accepts full responsibility for the content.
No artificial-intelligence system is listed as an
author.
References
- Mills S, Lee JK, Rassekh BM. An introduction
to the civil registration and vital statistics
systems with applications in low- and
middle-income countries. J Health Popul Nutr
2019;38(Suppl 1):23. doi:
10.1186/s41043-019-0177-1.
- World Health Organization. Civil registration
and vital statistics (CRVS) [Internet]. Geneva:
World Health Organization. Available from: https://www.who.int/data/data-collection-tools/civil-registration-and-vital-statistics-(crvs)
[Accessed 19 July 2026].
- Rao C. Elements of a strategic approach for
strengthening national mortality statistics
programmes. BMJ Glob Health
2019;4(5):e001810. doi:
10.1136/bmjgh-2019-001810.
- Office of the Registrar General, India. Civil
Registration System, India [Internet]. New
Delhi: Ministry of Home Affairs, Government of
India. Available from: https://crsorgi.gov.in/
[Accessed 19 July 2026].
- Kumar GA, Dandona L, Dandona R. Completeness
of death registration in the Civil Registration
System, India (2005 to 2015). Indian J Med
Res 2019;149(6):740-747. doi:
10.4103/ijmr.IJMR_1620_17.
- Basu JK, Adair T. Have inequalities in
completeness of death registration between
states in India narrowed during two decades of
civil registration system strengthening? Int
J Equity Health 2021;20(1):195. doi:
10.1186/s12939-021-01534-y.
- Rao C, Gupta M. The civil registration system
is a potentially viable data source for reliable
subnational mortality measurement in India. BMJ
Glob Health 2020;5(8):e002586. doi:
10.1136/bmjgh-2020-002586.
- Gupta M, Rao C, Lakshmi PVM, et al. Estimating
mortality using data from civil registration: a
cross-sectional study in India. Bull World
Health Organ 2016;94(1):10-21. doi:
10.2471/BLT.15.153585.
- Gupta A, Asadullah M, Kumar R, et al.
Exploratory analysis of the suitability of data
from the civil registration system for
estimating excess mortality due to COVID-19 in
Faridabad district of India. Indian J Med
Res 2022;156(3):421-428. doi:
10.4103/ijmr.ijmr_1421_21.
- Shewade HD, Parameswaran GG, Mazumder A, et
al. Adjusting Reported COVID-19 Deaths for the
Prevailing Routine Death Surveillance in India.
Front Public Health 2021;9:641991. doi:
10.3389/fpubh.2021.641991.
- Natarajan S, Subramanian P. Systematic Review
of Excess Mortality in India during the Covid-19
Pandemic with Differentiation between
Model-Based and Data-Based Mortality Estimates.
Indian J Community Med
2022;47(4):491-494. doi:
10.4103/ijcm.ijcm_11_22.
- Kumar K, Saikia N. Determinants of birth
registration in India: Evidence from NFHS
2015-16. PLoS One 2021;16(9):e0257014.
doi: 10.1371/journal.pone.0257014.
- Verma S, Dwivedi LK, Kamal R. Impact of
Institutionalisation of Births on Health
Policies and Birth Registration in India. Ann
Glob Health 2024;90(1):53. doi:
10.5334/aogh.4474.
- Paleker M, Boggs D, Jackson D, et al. Closing
the birth registration gap for Every newborn
facility birth: literature review and
qualitative research. Glob Health Action
2023;16(1):2286073. doi:
10.1080/16549716.2023.2286073.
- Bhatia A, Krieger N, Beckfield J, et al. Are
inequities decreasing? Birth registration for
children under five in low-income and
middle-income countries, 1999-2016. BMJ Glob
Health 2019;4(6):e001926. doi:
10.1136/bmjgh-2019-001926.
- Bhatia A, Ferreira LZ, Barros AJD, et al. Who
and where are the uncounted children?
Inequalities in birth certificate coverage among
children under five years in 94 countries using
nationally representative household surveys. Int
J Equity Health 2017;16(1):148. doi:
10.1186/s12939-017-0635-6.
- Dandona R, Majumder M, Kumar GA.
Population-level trends over a decade in
geographical inequality for opportunity in
access to maternal care services: a
cross-sectional analysis from the National
Family Health Surveys in India. BMJ Open
2024;14(11):e083922. doi:
10.1136/bmjopen-2024-083922.
- Morgenstern H. Ecologic Studies in
Epidemiology: Concepts, Principles, and Methods.
Annu. Rev. Public Health 1995;16:61-81.
doi: 10.1146/annurev.pu.16.050195.000425.
- International Institute for Population
Sciences (IIPS), ICF. National Family Health
Survey (NFHS-5), 2019-21: India: Volume I.
Mumbai: IIPS; 2021. Available from: https://dhsprogram.com/pubs/pdf/FR375/FR375.pdf
[Accessed 19 July 2026].
- von Elm E, Altman DG, Egger M, et al. The
Strengthening the Reporting of Observational
Studies in Epidemiology (STROBE) statement:
guidelines for reporting observational studies.
PLoS Med 2007;4(10):e296. doi:
10.1371/journal.pmed.0040296.
- Benjamini Y, Hochberg Y. Controlling the False
Discovery Rate: A Practical and Powerful
Approach to Multiple Testing. J R Stat Soc
Series B: Methodol 1995;57(1):289-300.
doi: 10.1111/j.2517-6161.1995.tb02031.x.
- Anand A, Khanna D, Singh P, et al. Evaluation
of Medical Certification of Cause of Death in
Tertiary Cancer Hospitals in Northern India. Health
Inf Manag 2024;53(2):121-128. doi:
10.1177/18333583221144665.
- Dash SK, Behera BK, Patro S. Accuracy in
certification of cause of death in a tertiary
care hospital--a retrospective analysis. J
Forensic Leg Med 2014;24:33-36. doi:
10.1016/j.jflm.2014.03.006.
- Chaudhary A, Singh G, Hooda A, et al. Impact
of an Educational Measure on the Quality of
Medical Certificate of Cause of Death at a
Tertiary Care Teaching Hospital: A Pre-post
Interventional Study. Cureus
2024;16(2):e54721. doi: 10.7759/cureus.54721.
- Thanigasalam A, Ramu R, Rajarethinam K.
Improving completeness and reducing errors in
medical certification of cause of death: The
impact of electronic mortality software in a
tertiary care centre in South India. Indian
J Med Res 2025;161(4):420-424. doi:
10.25259/IJMR_1394_2024.
- Juyal D, Kumar A, Pal S, et al. Medical
certification of cause of death during COVID-19
pandemic - a challenging scenario. J Family
Med Prim Care 2020;9(12):5896-5898. doi:
10.4103/jfmpc.jfmpc_1435_20.
- Naghavi M, Richards N, Chowdhury H, et al.
Improving the quality of cause of death data for
public health policy: are all 'garbage' codes
equally problematic? BMC Med
2020;18(1):55. doi: 10.1186/s12916-020-01525-w.
- Grover A, Nair S, Sharma S, et al.
Strengthening Cause of Death Statistics in
Selected Districts of 3 States in India:
Protocol for an Uncontrolled, Before-After,
Mixed Method Study. JMIR Res Protoc
2024;13:e51493. doi: 10.2196/51493.
- Verma S, Kamal R, Dwivedi LK, et al. Who gets
counted? Understanding low female death
registration in India. PLoS One
2025;20(11):e0337224. doi:
10.1371/journal.pone.0337224.
- Dandona R, George S, Majumder M, et al.
Stillbirth undercount in the sample registration
system and national family health survey, India.
Bull World Health Organ
2023;101(3):191-201. doi: 10.2471/BLT.22.288906.
- Mishra PS, Kumar P, Srivastava S. Regional
inequality in the Janani Suraksha Yojana
coverage in India: a geo-spatial analysis. Int
J Equity Health 2021;20(1):24. doi:
10.1186/s12939-020-01366-2.
- Agarwal SK, Mishra S. Health impact evaluation
of Aspirational Districts Program in India:
Evidence from National Family Health Survey. Econ
Hum Biol 2024;54:101411. doi:
10.1016/j.ehb.2024.101411.
Supplementary Material
Birth and death registration gap across 705
Indian districts, NFHS-5
Contents
S1. STROBE checklist for cross-sectional studies
(mapped to manuscript locations)
S2. Variance decomposition of registration
outcomes between and within states
S3. Sensitivity analysis without precision
weights
S4. Districts with birth registration of 90% or
more and death registration below 70%, by state
S5. Health-facility contact and registration
S6. Change between between-district and
within-state estimates
S7. Wild cluster bootstrap inference
S8. Fractional logit models with average marginal
effects
S9. Influence and robust estimation
S10. Sensitivity of the priority-district
classification
S1: STROBE checklist for cross-sectional
studies
This study is
reported in accordance with the Strengthening the
Reporting of Observational Studies in Epidemiology
(STROBE) statement for cross-sectional
observational studies.
|
No.
|
STROBE item
|
Location in manuscript
|
|
1a
|
Study design in title or abstract
|
Abstract; Material and Methods, "Study
design and data source"
|
|
1b
|
Informative and balanced abstract
|
Abstract
|
|
2
|
Scientific background and rationale
|
Introduction
|
|
3
|
Objectives
|
Introduction, final paragraph
|
|
4
|
Study design early in the paper
|
Material and Methods, "Study design and
data source"
|
|
5
|
Setting, locations, relevant dates
|
Material and Methods; India, 705
districts, survey fielded 2019-21
|
|
6a
|
Eligibility criteria and selection of
units
|
Material and Methods, "Analytical units"
|
|
7
|
Outcomes, exposures, confounders defined
|
Material and Methods, "Measures and their
denominators"
|
|
8
|
Sources of data and measurement methods
|
Material and Methods, "Study design and
data source" and "Measures and their
denominators"
|
|
9
|
Efforts to address sources of bias
|
Material and Methods, "Statistical
analysis"; Discussion, "Strengths and
limitations"; Tables S6 to S9
|
|
10
|
Study size
|
Material and Methods, "Analytical units";
all districts with complete data
|
|
11
|
Handling of quantitative variables
|
Material and Methods, "Measures and their
denominators" and "Statistical analysis"
|
|
12a
|
Statistical methods including confounding
control
|
Material and Methods, "Statistical
analysis"
|
|
12b
|
Subgroup and interaction methods
|
Not applicable; no subgroup or
interaction analyses were undertaken
|
|
12c
|
Handling of missing data
|
Material and Methods, "Analytical units";
complete-case panel, one listing error
excluded
|
|
12d
|
Accounting for analytical structure
|
Material and Methods, "Statistical
analysis"; state-clustered variance, state
fixed effects, wild cluster bootstrap
(Table S7)
|
|
12e
|
Sensitivity analyses
|
Results, "Sensitivity analyses"; Tables
S2, S3, S6 to S10
|
|
13
|
Numbers of units at each stage
|
Material and Methods, "Analytical units";
Results, first paragraph
|
|
14
|
Characteristics of study units
|
Results, "Registration levels and the
gap"; Table 1
|
|
15
|
Outcome data
|
Table 1; Table 4
|
|
16
|
Main results with precision
|
Tables 2 and 3; all estimates with 95%
confidence intervals
|
|
17
|
Other analyses
|
Results, "Districts where registration
systems are most discordant"; Tables S4 to
S10
|
|
18
|
Key results summarised
|
Discussion, first paragraph; Conclusion
|
|
19
|
Limitations
|
Discussion, "Strengths and limitations"
|
|
20
|
Cautious overall interpretation
|
Discussion; multiplicity corrected across
30 tests and no causal claim made
|
|
21
|
Generalisability
|
Discussion, "Strengths and limitations"
|
|
22
|
Funding
|
Declarations
|
S2: Variance decomposition of
registration outcomes
The proportion of
variation in each outcome attributable to
differences between states, obtained as the
coefficient of determination of a model containing
state indicators alone. A high between-state share
indicates that the outcome is determined
predominantly at the level of the state system
rather than the district, and it is also the
reason a reader might expect within-state
estimates to attenuate through regression dilution
alone. Table S6 addresses that objection directly.
|
Measure
|
Variance between states (%)
|
Variance within states, between
districts (%)
|
Districts
|
States
|
|
Birth registration
|
69.6
|
30.4
|
705
|
36
|
|
Death registration
|
82.3
|
17.7
|
705
|
36
|
|
Birth-minus-death registration gap
|
67.5
|
32.5
|
705
|
36
|
S3: Sensitivity analysis without
precision weights
Models identical to
Table 2 of the manuscript but fitted without
weighting by the number of households surveyed.
Closely similar estimates indicate that the
precision weighting does not drive the reported
findings.
|
Outcome
|
District indicator
|
Adjusted difference per 1 SD (95%
CI)
|
P
|
|
Birth registration
|
Women with 10 or more years of schooling
|
-0.12 (-1.66 to 1.41)
|
0.876
|
|
Birth registration
|
Improved sanitation facility
|
2.46 (0.85 to 4.08)
|
0.003
|
|
Birth registration
|
Clean cooking fuel
|
-0.15 (-2.13 to 1.84)
|
0.884
|
|
Birth registration
|
Any health insurance cover
|
1.24 (-1.14 to 3.61)
|
0.307
|
|
Birth registration
|
Institutional births
|
5.00 (3.57 to 6.44)
|
<0.001
|
|
Death registration
|
Women with 10 or more years of schooling
|
1.24 (-2.89 to 5.38)
|
0.556
|
|
Death registration
|
Improved sanitation facility
|
4.44 (0.80 to 8.09)
|
0.017
|
|
Death registration
|
Clean cooking fuel
|
2.93 (-1.72 to 7.59)
|
0.216
|
|
Death registration
|
Any health insurance cover
|
3.80 (-0.60 to 8.19)
|
0.091
|
|
Death registration
|
Institutional births
|
9.24 (6.86 to 11.62)
|
<0.001
|
|
Birth-minus-death registration gap
|
Women with 10 or more years of schooling
|
-1.36 (-4.59 to 1.86)
|
0.407
|
|
Birth-minus-death registration gap
|
Improved sanitation facility
|
-1.98 (-5.07 to 1.10)
|
0.207
|
|
Birth-minus-death registration gap
|
Clean cooking fuel
|
-3.08 (-6.08 to -0.09)
|
0.044
|
|
Birth-minus-death registration gap
|
Any health insurance cover
|
-2.56 (-5.04 to -0.07)
|
0.044
|
|
Birth-minus-death registration gap
|
Institutional births
|
-4.24 (-6.19 to -2.29)
|
<0.001
|
S4: Priority districts by state
All districts with birth registration of 90% or
more and death registration below 70%, aggregated
by state. These districts already register the
large majority of births and have near-average
institutional birth coverage, so the registration
apparatus and the health-system contact both
exist; what is absent is the death-side workflow.
Table S10 shows how sensitive this grouping is to
its thresholds.
|
State or union territory
|
Districts
|
Mean death registration (%)
|
Mean institutional births (%)
|
|
Assam
|
21
|
58.5
|
86.6
|
|
Arunachal Pradesh
|
11
|
41.7
|
81.8
|
|
Madhya Pradesh
|
9
|
61.2
|
89.5
|
|
Uttar Pradesh
|
9
|
55.5
|
92.9
|
|
Odisha
|
8
|
65.5
|
93.6
|
|
Jammu and Kashmir
|
6
|
65.4
|
93.7
|
|
Chhattisgarh
|
5
|
60.8
|
81.6
|
|
West Bengal
|
4
|
65.6
|
89.0
|
|
Uttarakhand
|
3
|
64.5
|
78.7
|
|
Telangana
|
2
|
58.2
|
97.2
|
|
Rajasthan
|
2
|
62.9
|
96.5
|
|
Manipur
|
2
|
52.8
|
56.6
|
|
Meghalaya
|
2
|
59.8
|
88.9
|
|
Andhra Pradesh
|
1
|
68.2
|
96.6
|
|
Maharashtra
|
1
|
68.1
|
94.0
|
|
Sikkim
|
1
|
68.4
|
91.8
|
|
Tripura
|
1
|
67.4
|
87.7
|
Table S5: Health-facility contact and
registration
Institutional birth
coverage is a marker of health-system contact with
the household. This table contrasts its
association with birth and with death registration
in models containing institutional births as the
only district indicator, estimated first across
all districts and then within states. The note
gives mean registration levels among the 417
districts where institutional births reached 90%
or more, showing that near-universal facility
delivery coexists with substantially incomplete
death registration.
|
Outcome
|
Spearman rho with institutional
births
|
Spearman P
|
Across all districts, beta per SD
|
Within states, beta per SD
|
Within-state P
|
|
Birth registration
|
0.607
|
<0.001
|
5.64
|
3.31
|
0.002
|
|
Death registration
|
0.670
|
<0.001
|
12.82
|
3.30
|
0.007
|
|
SD: standard deviation. Models
contain institutional births alone; the
within-state model adds state fixed
effects. These bivariate estimates
therefore differ from the fully adjusted
estimates in Tables 2 and 3, where the
within-state association with death
registration is -0.06 after conditioning
on the other four indicators. Among the
417 districts with institutional births
of 90% or more, mean birth registration
was 95.2% and mean death registration
81.5%.
|
Table S6: Change between between-district and
within-state estimates
Attenuation is the
percentage reduction in a coefficient when state
fixed effects are added. Ordinary regression
dilution would attenuate every predictor, because
the fixed effects absorb most of the variance in
death registration and leave a noisier residual.
Here only institutional births loses its
association; none of the other four correlates of
death registration changes significantly. The
difference between the two estimates is tested
treating them as independent, which is
conservative because they share data and are
positively correlated, so the true standard error
of the difference is smaller than the one used.
|
Outcome
|
Predictor
|
Across all districts (beta per
SD)
|
Within states (beta per SD)
|
Attenuation (%)
|
Difference
|
P for difference
|
|
Birth registration
|
Women with 10 or more years of schooling
|
-0.15
|
0.39
|
368.1
|
0.54
|
0.556
|
|
Birth registration
|
Improved sanitation facility
|
2.51
|
0.73
|
70.9
|
-1.78
|
0.069
|
|
Birth registration
|
Clean cooking fuel
|
-0.12
|
-0.22
|
-82.8
|
-0.10
|
0.931
|
|
Birth registration
|
Any health insurance cover
|
1.29
|
1.58
|
-23.0
|
0.30
|
0.832
|
|
Birth registration
|
Institutional births
|
5.05
|
2.87
|
43.2
|
-2.18
|
0.136
|
|
Death registration
|
Women with 10 or more years of schooling
|
1.06
|
1.75
|
-65.1
|
0.69
|
0.765
|
|
Death registration
|
Improved sanitation facility
|
4.54
|
3.31
|
27.1
|
-1.23
|
0.553
|
|
Death registration
|
Clean cooking fuel
|
3.16
|
2.45
|
22.6
|
-0.72
|
0.789
|
|
Death registration
|
Any health insurance cover
|
3.91
|
5.26
|
-34.4
|
1.35
|
0.677
|
|
Death registration
|
Institutional births
|
9.13
|
-0.06
|
100.6
|
-9.19
|
<0.001
|
|
Birth-minus-death registration gap
|
Women with 10 or more years of schooling
|
-1.21
|
-1.36
|
-12.6
|
-0.15
|
0.934
|
|
Birth-minus-death registration gap
|
Improved sanitation facility
|
-2.03
|
-2.58
|
-26.9
|
-0.55
|
0.771
|
|
Birth-minus-death registration gap
|
Clean cooking fuel
|
-3.28
|
-2.67
|
18.8
|
0.62
|
0.736
|
|
Birth-minus-death registration gap
|
Any health insurance cover
|
-2.63
|
-3.68
|
-40.0
|
-1.05
|
0.658
|
|
Birth-minus-death registration gap
|
Institutional births
|
-4.08
|
2.93
|
171.7
|
7.01
|
<0.001
|
|
SD: standard deviation. Attenuation
is undefined in direction when a
coefficient changes sign, and is large
when the between-district estimate is
close to zero; it should be read
together with the difference and its P
value.
|
Table S7: Wild cluster bootstrap inference
With 36 state
clusters the cluster-robust sandwich is known to
reject too often, because asymptotic cluster
inference assumes many clusters. P values for the
principal contrast were therefore recomputed by
wild cluster bootstrap with 4,999 Rademacher draws
and the null imposed on the restricted fit.
Conclusions are unchanged.
|
Outcome
|
Term
|
Specification
|
Coefficient (per SD)
|
Cluster-robust P
|
Wild bootstrap P
|
Draws
|
|
Death registration
|
Institutional births
|
Across all districts
|
9.13
|
<0.001
|
0.0002
|
4,999
|
|
Death registration
|
Institutional births
|
Within states
|
-0.06
|
0.959
|
0.961
|
4,999
|
|
Birth registration
|
Institutional births
|
Across all districts
|
5.05
|
<0.001
|
0.0002
|
4,999
|
|
Birth registration
|
Institutional births
|
Within states
|
2.87
|
0.023
|
0.002
|
4,999
|
|
SD: standard deviation. With 4,999
draws the smallest attainable bootstrap
P value is 0.0002.
|
Table S8: Fractional logit models with average
marginal effects
Birth and death
registration are bounded percentages, so a linear
model can predict outside the admissible range and
imposes constant marginal effects across it.
Models were refitted as fractional
(quasi-binomial) logits with a logit link and
cluster-robust variance, and are reported as
average marginal effects in percentage points so
that they remain comparable with the linear
estimates. The pattern matches the linear models.
|
Outcome
|
Specification
|
Predictor
|
Average marginal effect
(percentage points per SD)
|
P
|
|
Birth registration
|
Across all districts
|
Women with 10 or more years of schooling
|
0.27
|
0.759
|
|
Birth registration
|
Across all districts
|
Improved sanitation facility
|
2.18
|
<0.001
|
|
Birth registration
|
Across all districts
|
Clean cooking fuel
|
0.25
|
0.850
|
|
Birth registration
|
Across all districts
|
Any health insurance cover
|
1.48
|
0.265
|
|
Birth registration
|
Across all districts
|
Institutional births
|
3.40
|
<0.001
|
|
Birth registration
|
Within states
|
Women with 10 or more years of schooling
|
0.13
|
0.748
|
|
Birth registration
|
Within states
|
Improved sanitation facility
|
0.99
|
0.076
|
|
Birth registration
|
Within states
|
Clean cooking fuel
|
0.05
|
0.901
|
|
Birth registration
|
Within states
|
Any health insurance cover
|
2.19
|
0.007
|
|
Birth registration
|
Within states
|
Institutional births
|
1.95
|
0.021
|
|
Death registration
|
Across all districts
|
Women with 10 or more years of schooling
|
1.80
|
0.437
|
|
Death registration
|
Across all districts
|
Improved sanitation facility
|
3.82
|
0.026
|
|
Death registration
|
Across all districts
|
Clean cooking fuel
|
3.39
|
0.207
|
|
Death registration
|
Across all districts
|
Any health insurance cover
|
3.99
|
0.077
|
|
Death registration
|
Across all districts
|
Institutional births
|
7.47
|
<0.001
|
|
Death registration
|
Within states
|
Women with 10 or more years of schooling
|
2.03
|
0.015
|
|
Death registration
|
Within states
|
Improved sanitation facility
|
3.20
|
<0.001
|
|
Death registration
|
Within states
|
Clean cooking fuel
|
2.69
|
0.015
|
|
Death registration
|
Within states
|
Any health insurance cover
|
5.82
|
0.007
|
|
Death registration
|
Within states
|
Institutional births
|
-0.55
|
0.528
|
|
SD: standard deviation.
|
Table S9: Influence and robust estimation
Each model was
refitted 36 times, omitting one state in turn, and
additionally by Huber M-estimation to limit the
leverage of influential districts. The
between-district estimate is stable across
omissions; the within-state estimate crosses zero,
as expected for an estimate centred on the null.
Table S9a: Leave-one-state-out
estimates for institutional births and death
registration
|
Specification
|
Models fitted (one state omitted
each)
|
Minimum
|
Median
|
Maximum
|
Same sign in every model
|
|
Across all districts
|
36
|
8.56
|
9.13
|
9.52
|
Yes
|
|
Within states
|
36
|
-0.55
|
-0.07
|
0.69
|
No
|
|
Estimates are percentage points of
death registration per one standard
deviation higher institutional birth
coverage.
|
Table S9b: Huber M-estimation
|
Outcome
|
Specification
|
Huber estimate for institutional
births (per SD)
|
P
|
|
Birth registration
|
Across all districts
|
4.84
|
<0.001
|
|
Birth registration
|
Within states
|
1.98
|
<0.001
|
|
Death registration
|
Across all districts
|
9.77
|
<0.001
|
|
Death registration
|
Within states
|
0.18
|
0.758
|
|
SD: standard deviation.
|
S10. Sensitivity of the priority-district
classification
The published district estimates carry no
standard errors, so classification uncertainty is
assessed by moving both thresholds and by counting
districts near a boundary. Group size varies from
41 to 142 districts across the threshold
combinations examined, and 264 districts lie
within five percentage points of one boundary or
the other. Individual district membership is
therefore indicative rather than definitive,
although the existence of a substantial group
registering most births and few deaths is not
sensitive to the cut-points.
|
Birth registration threshold (%)
|
Death registration threshold (%)
|
Districts identified
|
States represented
|
Mean death registration (%)
|
|
90
|
70
|
88
|
17
|
58.6
|
|
85
|
70
|
142
|
20
|
56.5
|
|
95
|
70
|
41
|
11
|
60.4
|
|
90
|
65
|
60
|
13
|
54.2
|
|
90
|
75
|
135
|
20
|
63.4
|
|
85
|
65
|
102
|
16
|
52.1
|
|
95
|
75
|
61
|
15
|
64.5
|
Reproducibility
Analyses used Python 3.14 with pandas, NumPy,
statsmodels, SciPy and Matplotlib, with a fixed
random seed. All tables and figures are generated
directly by the analysis and figure scripts
without manual editing. Every reference in the
manuscript was retrieved programmatically from
PubMed or Crossref, or recorded with a URL
confirmed reachable; none was transcribed by hand,
and the reference list was independently
re-verified against freshly retrieved PubMed
records before submission. The derived analytical
file and the complete analysis code accompany this
submission.
|


