|
Introduction
Cervical
cancer is one of the most common contributor to
the global burden of disease. In 2018,
approximately 90% of the 570,000 new cases and
311,000 mortalities have been reported to occur in
under developed and developing nations, where
systematic screening does not exist or has been
poorly implemented. [1]
Invasive squamous
cell carcinoma of cervix is preceded by the
development of dysplastic changes which gradually
progress to HSIL and invasive carcinoma over a
duration of two decades. Because there are few
symptoms during this preinvasive period, there is
a wide window of opportunity during which
identification and intervention are still
possible. The main aetiological cause is
unquestionably persistent infection by high-risk
human papillomavirus (HPV) genotypes, particularly
types 16 and 18, although tobacco use,
immunosuppression, and poor genital hygiene are
considered important cofactors. [2]
Since its
introduction in the 1940s, the Papanicolaou smear
has emerged as a highly efficient screening tool
to detect precancerous and cancerous lesions based
on the nuclear and cytoplasmic characteristics.
However, certain limitations exists such as the
lack of human resources to screen the slides,
time-consuming, and interobserver variability.
Moreover, the indeterminate categories like ASC-US
(Atypical Squamous Cells of Undetermined
Significance) is quite challenging. [3, 4] The
drawbacks of this hierarchy have led to a growing
trend toward computer-assisted image analysis and
machine learning, which promise a diagnostic
framework that is both repeatable and
observer-independent. [5]
The AI algorithms
currently in use, depend on the nuclear
characteristics like size, shape, colour or deep
learning based image categorization. Lack of
uniformity across various imaging platforms, and
limited interpretability makes its use
challenging. [6-8] Alterations in the nuclear
chromatin architecture is one of the most
significant changes that occur as the cell
transitions through various grades of dysplasia
and eventually carcinoma, [9] This objective
quantifiable parameter has been less frequently
evaluated, more so in cervical carcinogenesis [8].
Gray-Level Co-occurrence Matrix (GLCM) texture
analysis is a quantifiable parameter which
reflects chromatin organization by measuring the
spatial connexions between pixel intensities. This
quantifies variations in chromatin heterogeneity,
entropy, and local contrast which is not
appreciated at routine light microscopy [8].
Researchers have investigated the utility of GLCM
in various imaging applications, its role in
cervical cytology has not been adequately
explored.
Hence the present
study was planned with the aim to evaluate the
role of nuclear morphometric parameters and
GLCM-based texture features in conventional
cervical Pap smears. If found useful, these novel
parameters would improve discrimination between
normal, precancerous and cancerous lesions of
cervix and also provide objective adjunct image
biomarkers which can be integrated into future
computer-assisted and AI-enabled cervical cancer
screening algorithms.
Material and Methods
This was a
cross-sectional diagnostic analytical study
conducted at the department of pathology, at a
tertiary care hospital, over a duration of one
year from January 2023 to December 2023. The
method of sampling was convenient sampling
technique.
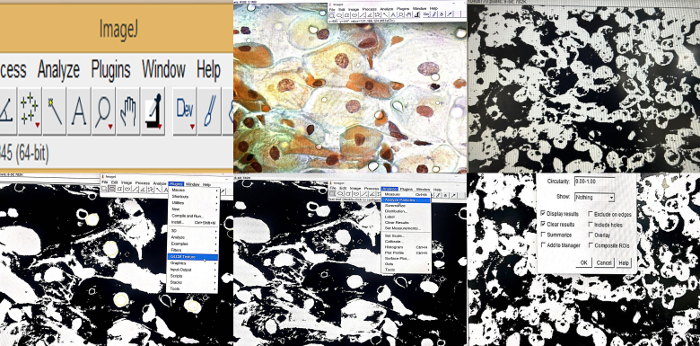
|
|
Figure
1: Image showing the methodological
workflow for GLCM texture analysis on
cervical cytology smears utilizing the
ImageJ software.A: Shows the interface
of Image J software. B: Shows the Pap
smear image used for analysis.C:
Generation of Binary image. D: Setting
thresholds and segmentation. E:
Morphometric assessment using Analyze
particles function. F: Analysing
Gray-Level Co-occurrence Matrix (GLCM)
Texture using GLCM plugin
|
The study was
conducted as per the ethical principles of
declaration of Helsinki and the ethical clearance
for the study protocol was obtained from the
Institutional ethical committee AIMS,IEC. Written
informed consent was obtained from each of the
participants at the beginning of sample
collection,
The cervical smears
from women aged 25 years to 60 years, attending
outpatient department of gynaecology were obtained
by the clinician following standard sampling
protocol, fixed in 95% ethyl alcohol and stained
using the conventional Papanicolaou staining
technique.
Selection of
cytology images
The smears were
reviewed separately by two independent
cytopathologists with more than 10 years’
experience and who were blinded for the diagnosis.
After consensus opinion, further evaluation was
performed.
Initially we
selected six cases each of negative for
Intraepithelial Lesion or Malignancy (NILM),
Atypical Squamous Cells of Undetermined
Significance (ASCUS), Low-grade Squamous
Intraepithelial Lesion (LSIL), Atypical Squamous
Cells-high grade lesion cannot be excluded
(ASC-H), High-grade Squamous Intraepithelial
Lesion (HSIL) and Squamous Cell Carcinoma (SCC)
diagnosed on pap smear using Bethesda system for
reporting cervical cytology. (Figure 2)

|
| Figure
2: Cervical cytology smears (Papanicolaou,
x 400) A: Negative for Intraepithelial
Lesion or Malignancy (NILM) showing mature
intermediate squamous cells with
normochromatic nuclei and regular nuclear
membrane. B: Atypical squamous cells of
undetermined significance (ASCUS) showing
mild nuclear enlargement but regular
nuclear membrane and texture. C: Low-grade
Squamous Intraepithelial Lesion (LSIL).
Mild nuclear enlargement, nuclear membrane
irregularity and mildly coarse chromatin
D. High-grade Squamous Intraepithelial
Lesion (HSIL) showing marked irregularity
in nuclear membrane and coarse chromatin
along with increased
nuclear-to-cytoplasmic ratio. |
Slides were
visualized and images captured using a trinocular,
digital microscope connected to a camera under 40×
objective magnification (400× total
magnification). Measures were taken to maintain
uniformity exposure, white balance settings and
illumination during image capture. High
resolution, uncompressed images were saved in a
dedicated workstation for further image analysis.
Selection of
Region of Interest (ROI)
From each case
approximately 4 to 5 squamous epithelial cells
were selected by the researchers who were blinded
for the quantitative image analysis, for nuclear
morphometric and GLCM analysis. Cells with
well-preserved morphology, without any overlap,
and demonstrating crisp nuclear details, and
uniform staining characteristics were selected for
the analysis. Cells with poor fixation, drying
artefact, details obscured by inflammation or
degeneration were excluded from the analysis. To
minimize sampling bias, multiple nuclei were
selected across various microscopic fields and the
mean of all the analysed nuclei was taken as the
final value.
A total of 166 cells
were analysed among the various study groups which
included 64 from NILM, 26 diagnosed as ASCUS, 24
diagnosed as LSIL and 52 which were diagnosed as
HSIL/SCC.
Pre-processing
of images
For morphometric and
texture analysis, Image J software was used. Each
nuclei represented region of interest (ROI) for
both nuclear morphometric and GLCM analysis.
Normalization of background and contrast
optimization was done to reduce illumination
variations and maintain good chromatin
architecture respectively for each image. Image
scale was calibrated using standards. Each nuclei
was subjected to manual segmentation. Further it
was converted to 8-bit grayscale image before
preforming extraction. The parameters assessed for
nuclear morphometric included area, ferret and
perimeter. Similarly for GLCM, the parameters
assessed were Angular Second Moment (ASM), Inverse
Difference Moment (IDM), Contrast, Correlation,
and Entropy.
Processing
of images for nuclear morphometric analysis
Manual segmentation
of nuclear boundaries was done followed by the
analysis of following nuclear morphometric
parameters: i) nuclear area which represented the
total number of pixels inside the nuclear membrane
and was expressed in square micrometres (µm²). ii)
Nuclear parameter represented the total length of
the nuclear membrane expressed in micrometres.
iii) Feret diameter represented the longest
distance between any two points on the nuclear
membrane. These parameters basically reflect the
nuclear geometry and size which in turn are the
know indicators or dysplastic and malignant
changes.
Texture
analysis using Grey-Level Co-occurrence Matrix
(GLCM)
Gray-Level
Co-occurrence Matrix (GLCM) is an objective tool
for determining the chromatin organization and
nuclear texture.
As stated earlier
the segmented nuclei were transformed into 8-bit
grayscale format, which generated pixel intensity
values ranging from 0 (black) to 255 (white).
In this analysis, a
GLCM is produced for each nucleus by computing the
rate at which pairs of pixels with specific
gray-level values occurred at a distinct spatial
relationship within the nuclear image. The GLCM
analysis uses a higher order statistical method to
quantify spatial relationship among the adjacent
pixels which in turn is reflective of the
chromatin distribution pattern. The texture
Analyser plugin of Image J software was utilized
to obtain the texture features.
Following GLCM
features were determined: i) Angular Second Moment
(ASM) which indicated textural uniformity. ii)
Inverse Difference Moment (IDM) indicates local
homogeneity. iii) Contrast indicates local
intensity variation.iv) Correlation indicates the
linear dependence amongst adjacent pixel
intensities. v) Entropy represents randomness and
disorder in the chromatin.
To ensure
measurement reproducibility, 10% of the randomly
selected images were subjected to re-analysis
after a duration of 2 weeks. The average of the
measurements were used to analyse intra-observer
reproducibility.
Statistical
analysis
Data was entered in
Microsoft excel and the statistical analysis was
done using SPSS software latest version.
Continuous variables were expressed as mean ±
standard deviation (SD). Categorical variables
were expressed as frequencies and percentages.
Comparisons among various groups were performed
using one-way Analysis of Variance (ANOVA). The
statistical significance level was set at p <
0.05.
Results
The present study
included analysis of 166 cells. These cells
included 64 from NILM, 26 diagnosed as ASCUS, 24
diagnosed as LSIL and 52 which were diagnosed as
HSIL/SCC. (Table 1)
|
Table 1: Distribution of nuclei
analysed across various cytodiagnostic
categories
|
|
Diagnosis
|
Cases
|
Nuclei analysed
|
Percentage
|
|
NILM
|
6
|
64
|
38.6
|
|
ASCUS
|
6
|
26
|
15.7
|
|
LSIL
|
6
|
24
|
14.5
|
|
HSIL/SCC
|
12
|
52
|
31.3
|
|
Total
|
30
|
166
|
100
|
Nuclear
morphometry: Comparison of nuclear
morphometry parameters across various
cytodiagnostic categories is shown in Table 2.
|
Table 2: Comparison of Nuclear
morphometry parameters across various
cytodiagnostic categories
|
|
Parameters
|
Categories
|
N
|
Mean
|
Std. Deviation
|
95% Confidence Interval of Mean
|
p value
|
|
Lower Bound (95% CI)
|
Upper Bound (95% CI)
|
|
Area
|
NILM+Atrophy
|
64
|
2543.20
|
1863.235
|
2077.78
|
3008.63
|
0.160
|
|
HSIL+SCC
|
52
|
1994.75
|
1256.159
|
1645.03
|
2344.47
|
|
ASCUS
|
26
|
2622.50
|
1346.179
|
2078.77
|
3166.23
|
|
LSIL
|
24
|
2222.13
|
413.430
|
2047.55
|
2396.70
|
|
PERIM
|
NILM+Atrophy
|
64
|
180.97
|
59.78
|
166.03
|
195.90
|
0.032
|
|
HSIL+SCC
|
52
|
172.29
|
45.31
|
159.68
|
184.91
|
|
ASCUS
|
26
|
207.24
|
56.28
|
184.51
|
229.97
|
|
LSIL
|
24
|
173.74
|
15.68
|
167.12
|
180.37
|
|
FERIT
|
NILM+Atrophy
|
64
|
55.60
|
18.03
|
51.09
|
60.10
|
0.095
|
|
HSIL+SCC
|
52
|
50.58
|
14.25
|
46.61
|
54.55
|
|
ASCUS
|
26
|
59.08
|
12.93
|
53.86
|
64.31
|
|
LSIL
|
24
|
54.20
|
4.85
|
52.15
|
56.25
|
Nuclear
area:
In the present
study, though variation was observed in the mean
nuclear areas across the various diagnostic
categories, it was not statistically significant
(p=0.160). A marginal increase in mean nuclear
area was noted for ASCUS as compared to NILM
(2622.50 ± 1340.18 µm² vs 2543.20 ± 1863.24 µm²
respectively). Nevertheless, a gradual reduction
in the mean nuclear areas was noted for LSIL and
HSIL/SCC group (2222.13 ± 413.43 µm² vs 1994.75 ±
1256.16 µm² respectively).
Nuclear
Perimeter:
In the present
study, there was a statistically significant
difference in the perimeter among NILM, ASCUS,
LSIL and HSIL/SCC categories (p = 0.032). ASCUS
category showed highest mean perimeter followed by
NILM (207.24 ± 96.28 µm versus 180.97 ± 57.98 µm).
Importantly, mean perimeter showed a progressively
decreasing trend with LSIL perimeter of 173.74 ±
15.68 µm, and HSIL/SCC perimeter as 172.29 ± 45.31
µm.
Ferret
In the present
study, there was a progressive reduction in Feret
diameter from ASCUS to HSIL/SCC; however, this
difference was not statistically significant (p =
0.095). Feret diameter for NILM was found to be
55.60 ± 18.03 µm, whereas Feret
diameter for ASCUS was slightly higher value
(59.08 ± 12.93 µm). LSIL demonstrated lower values
of 54.20 ± 4.85 µm similar to
HSIL/SCC which showed Feret value of 50.58 ± 14.25
µm).
Overall to
summarise, there was a statistically significant
difference in nuclear perimeter among NILM, ASCUS,
LSIL and HSIL+SCC categories (p 0.032). However
other nuclear morphometric parameters like nuclear
area and Feret did not show any difference among
various groups.
GLCM texture
analysis: Comparison of GLCM Textural
parameters across various cytodiagnostic
categories is shown in Table 3.
|
Table 3: Comparison of GLCM
Textural parameters across various
cytodiagnostic categories
|
|
|
N
|
Mean
|
Std. deviation
|
Lower Bound (95% CI)
|
Upper Bound (95% CI)
|
P value
|
|
Angular Second Moment
|
NILM+Atrophy
|
54
|
.98306
|
.00288
|
.98227
|
.98384
|
<0.001
|
|
HSIL+SCC
|
53
|
.58040
|
.16056
|
.53614
|
.62465
|
<0.001
|
|
ASCUS
|
29
|
.64555
|
.21269
|
.56465
|
.72645
|
<0.001
|
|
LSIL
|
24
|
.88583
|
.17714
|
.81103
|
.96063
|
<0.001
|
|
Contrast
|
NILM+Atrophy
|
54
|
30.70
|
10.05
|
27.96
|
33.45
|
<0.001
|
|
HSIL+SCC
|
53
|
2459.10
|
1920.66
|
1929.70
|
2988.50
|
<0.001
|
|
ASCUS
|
29
|
1283.90
|
829.85
|
968.25
|
1599.55
|
<0.001
|
|
LSIL
|
24
|
506.55
|
781.39
|
176.60
|
836.51
|
<0.001
|
|
Correlation
|
NILM+Atrophy
|
54
|
.00213
|
.00034
|
.00204
|
.00222
|
<0.001
|
|
HSIL+SCC
|
53
|
.00014
|
.00021
|
.00008
|
.00020
|
<0.001
|
|
ASCUS
|
29
|
.00021
|
.00023
|
.00012
|
.00030
|
<0.001
|
|
LSIL
|
24
|
.00117
|
.00104
|
.00073
|
.00161
|
<0.001
|
|
Angular Different Moment
|
NILM+Atrophy
|
54
|
.99944
|
.00050
|
.99931
|
.99958
|
<0.001
|
|
HSIL+SCC
|
53
|
.96225
|
.02962
|
.95408
|
.97041
|
<0.001
|
|
ASCUS
|
29
|
.98031
|
.01284
|
.97543
|
.98519
|
<0.001
|
|
LSIL
|
24
|
.99233
|
.01215
|
.98720
|
.99747
|
<0.001
|
|
Entropy
|
NILM+Atrophy
|
54
|
.05113
|
.00743
|
.04910
|
.05316
|
<0.001
|
|
HSIL+SCC
|
53
|
.70304
|
.25190
|
.63361
|
.77247
|
<0.001
|
|
ASCUS
|
29
|
.57890
|
.30497
|
.46289
|
.69490
|
<0.001
|
|
LSIL
|
24
|
.21633
|
.27429
|
.10051
|
.33216
|
<0.001
|
Angular
Second Moment (ASM)
In the present
study, there was a statistically significant
difference in Angular Second Moment acrossNILM,
ASCUS, LSIL and HSIL/SCC categories (p <
0.001). Highest value of ASM (0.9831 ± 0.0028) was
observed for NILM category, which indicates
homogeneity in chromatin texture in this category.
In contrast, the HSIL/SCC category showed low ASM
values (0.5804 ± 0.1605), which indicate chromatin
heterogeneity. Indeterminate values obtained for
ASCUS and LSIL reflected a gradual progression
from normal to disorganised chromatin pattern.
Contrast
In the present
study, showed a statistically significant
difference across various diagnostic categories
from NILM, ASCUS, LSIL and HSIL/SCC categories (p
< 0.001). NILM demonstrated lowest contrast
(82.70 ± 10.05), as compared to HSIL/SCC which
showed highest values (2469.10 ± 1302.66),
Contrast represent local variation in chromatic
heterogeneity and in the present study the
findings obtained reflects the occurrence of
marked chromatin irregularity and nuclear atypia
across the categories. Intermediate values of
contrast for ASCUS and LSIL indicate the
progressive increase in chromatin variability with
increasing severity of epithelial dysplasia.
Correlation
In the present
study, there was a statistically significant
difference in correlation across various
diagnostic categories from NILM, ASCUS, LSIL and
HSIL/SCC categories (p < 0.001). Higher values
if correlation were observed for NILM as compared
to HSIL/SCC groups (0.00219 ± 0.00084, vs 0.00008
± 0.00001) respectively. Intermediate values of
contrast for ASCUS and LSIL indicate advanced
chromatin disruption with increasing severity of
epithelial dysplasia.
Inverse
Difference Moment (IDM/Angular Difference
Moment)
In the present
study, there was a statistically significant
difference in Inverse Difference Moment (IDM),
across various diagnostic categories from NILM,
ASCUS, LSIL and HSIL/SCC categories (p <
0.001). High IDM values were observed for NILM and
ASCUS nevertheless, a successive reduction was
observed across LSIL and HSIL/SCC, and the lowest
IDM values were noted in HSIL/SCC (0.95275 ±
0.00792). These findings show that there is
increase in chromatin heterogeneity with the
increase in lesion severity.
Entropy
In the present
study, there was a statistically significant
difference in entropy, across various diagnostic
categories from NILM, ASCUS, LSIL and HSIL/SCC
categories (p < 0.001). Lowest values of
entropy were observed for NILM (0.1513 ± 0.0819),
as compared to HSIL/SCC which showed the highest
values (0.7030 ± 0.2513), reflecting shows
chromatin disorganisation.
Trend analysis: Progressive
Trend across various across various cytodiagnostic
categories is shown in Table 4.
|
Table 4: Progressive Trend across
various across various cytodiagnostic
categories
|
|
Variable
|
NILM
|
ASCUS
|
LSIL
|
HSIL/SCC
|
Trend
|
|
Nuclear area (µm²)
|
2543.20
|
2622.50
|
2222.13
|
1994.75
|
Overall decreasing after ASCUS
|
|
Perimeter (µm)
|
180.97
|
207.24
|
173.74
|
172.29
|
No consistent monotonic trend
|
|
Feret diameter (µm)
|
55.60
|
59.08
|
54.20
|
50.58
|
Overall decreasing
|
|
Angular Second Moment (ASM)
|
0.9831
|
0.4495
|
0.8985
|
0.5804
|
Overall decreasing (less texture
uniformity)
|
|
Contrast
|
82.70
|
1238.10
|
305.95
|
2469.10
|
Overall increasing
|
|
Correlation
|
0.00219
|
0.00021
|
0.00117
|
0.00008
|
Overall decreasing
|
|
Inverse Difference Moment (IDM)
|
0.97944
|
0.98011
|
0.97233
|
0.95275
|
Overall decreasing
|
|
Entropy
|
0.15133
|
0.57800
|
0.26033
|
0.70304
|
Overall increasing
|
The
Jonckheere–Terpstra test was applied to determine
the trend across various groups according to the
increasing grades of severity of atypia. Initially
increasing trend followed by a decreasing trend
was noted for nuclear area as the lesions
progressed after the ASCUS through LSIL, HSIL and
SCC. Other parameters in nuclear morphometry like
perimeter and Feret diameter did not show any
significant trend. As for GLCM parameters, Angular
Second Moment showed a decreasing trend indicating
less texture uniformity as the disease progressed.
Increase trend in contrast was noted reflecting
the increase in the higher chromatin heterogeneity
and increasing nuclear atypia. Similarly findings
were reported for entropy suggesting increasing
nuclear complexity and chromatin disorganization
with the increasing grades of severity. Decreasing
Inverse Difference Moment (IDM) also reflected
similar findings.
Discussion
Cervical cancer
screening traditionally relies on cytological
evaluation, yet interpretation of Pap smears is
often limited by subjectivity and considerable
inter observer variability. Nuclear morphometric
analysis in cytology introduced an element of
objectivity in cytology. Further, with the advent
of fractal geometry, the complexity and
irregularity of the cellular structures were
measured. [8-9] Moving ahead, Computer assisted
diagnostic algorithms enhanced consistency and
reduced observer fatigue, thereby strengthening
large scale screening reliability. [6]
Significant
advancements has been made in incorporating
artificial intelligence and machine learning in
diagnostic cytopathology. Earlier, Prieto
Bohórquez et al. and Adam et al., used
mathematical characterization of nuclear
architecture [10, 11]. Later, Win et al. utilizes
fully automated screening systems for cellular
classification with high diagnostic accuracy. [7]
This advancement echoes the shift towards digital
pathology and AI driven diagnostic algorithms in
routine practice.
Earlier researchers
primarily used nuclear segmentation, in automated
cytology, whereas recent studies has shown the
importance of cytoplasmic segmentation and the
resolution of overlapping cells using marker
controlled watershed transformation. Consistent
with prior reports, the present research supports
the integration of mathematical image analysis and
computer assisted diagnostic (CAD) systems as a
means to enhance cervical cytology, transforming
it into a more precise, reproducible, and
objective diagnostic approach. [3, 7]
The present study
demonstrates that GLCM texture analysis emerge as
objective markers for differentiating cervical
lesions by reflecting more chromatin texture
alterations accompanying cervical neoplastic
transformation, whilst nuclear morphometry
parameters showed overall less distinguishing
ability.
Nuclear
morphometry: In the present study, a
significant difference was noted in the nuclear
parameter from NILM to HSIL/SCC categories. The
nuclear perimeter was highest in ASCUS category,
which decreased progressively across LSIL,
followed by HSIL/SCC categories. Although nuclear
area and Feret showed a decreasing trend, the
difference was not statistically significant.
These findings are consistent with earlier
studies. [10] Among the nuclear morphometric
parameters evaluated, nuclear perimeter was the
only parameter that demonstrated a statistically
significant difference across diagnostic
categories, whereas nuclear area and Feret
diameter showed decreasing trends without reaching
statistical significance. Technical aspects like
fixation, smear preparation along with overlapping
nuclear features among dysplastic grades may have
influenced nuclear area values. Interestingly,
ASCUS exhibited the highest perimeter values
followed by a progressive decline in LSIL and
HSIL/SCC. These findings advocate that despite
nuclear size being a reliable marker of
carcinogenesis, individual nuclear morphometric
parameters do not reliably reflect the
multifaceted architectural alterations occurring
within the dysplastic nuclei. Earlier studies
reveal similar findings, wherein researchers
observed that the individual morphometric
parameters alone are not reliable, however, the
combined use of multiple parameters are better
markers for reflecting underlying biological
changes.[10]
Angular
Second Moment (ASM): Alteration in the
chromatin architecture reflected as texture is an
important hallmark of neoplastic transformation
and progression. In normal epithelial cells, the
chromatin is uniformly distributed, and as the
lesion progresses from LSIL to HSIL/SCC, the
architecture is markedly altered and is reflected
by heterogenous chromatin distribution. Angular
Second Moment (ASM), is a GLCM parameter which
reflects chromatin texture uniformity. [8, 13] In
the present study, there was a progressive
reduction in ASM values from NILM to HSIL/SCC.
Similar findings were reported by Win et al.,
wherein they reported ASM as the strongest
discriminator of malignant cells in cervical
cytology using computer assisted cytology systems.
[7]
Contrast:
Contrast provides information about the local
intensity changes with respect to adjacent pixels
and is a marker of coarseness of chromatin
aggregation and irregularity. With increasing
grades of dysplasia the chromatin becomes
increasingly coarse and similarly, the contrast
values also increase with neoplastic
transformation and progression. In the present
study, there was thirty-fold increase in contrast
values from NILM to HSIL/SCC. Similar findings
have been reported by other authors in digital
cytology studies evaluating cervical lesions. [8,
13]
Correlation:
Correlation shows linear dependency among adjacent
pixel intensities and is an indicator of
preservation of chromatin pattern. In normal
epithelial nuclei, neighbouring pixels have
similar intensities and hence the correlation
values are high. In dysplastic nuclei, the
chromatin is randomly distributed and hence the
correlation is decreased. Similar findings were
reported by Win et al., who observed decreasing
correlation values with increasing severity of
dysplasia. [8, 13]
Inverse
Difference Moment (IDM): Inverse
Difference Moment (IDM), is a marker of nuclear
homogeneity. In the sequential transformation of
carcinogenesis IDM is reduced progressively, from
NILM to HSIL/SCC. IDM values are high in NILM and
ASCUS reflecting uniform chromatin organization,
whereas significantly lower values in HSIL/SCC
support increasing chromatin heterogeneity. IDM
measures chromatin smoothness and increase in IDM
mirrors increase in nuclear irregularity,
signifying malignant transformation. These
findings suggest that IDM may complement ASM in
objectively determining chromatin disorganization
at the cellular level. [8]
Entropy:
Entropy is a measure of randomness or disorder in
a system. Increase in entropy in the nuclei
indicates increase in disorganization of the
chromatin which is a hallmark of malignancy. In
the present study, there was a progressive
increase in entropy from NILM to HSIL/SCC and this
was statistically significant. The disorganization
in chromatin occurring during malignant
transformation and progression results from
several factors including chromosomal instability,
irregular chromatin condensation and abnormal DNA
replication. Several other studies have shown
increase in entropy with increasing grades of
dysplasia in various organ systems like oral,
prostate and breast cancer. [8, 9]
Overall GLCM texture
parameters showed a specific trend from normal to
increasing grades of epithelial dysplasia and
malignancies. From NILM through HSIL/SCC, ASM and
IDM values showed a decreasing trend, while
contrast and entropy showed a progressively
increasing trend. The present study demonstrated
intermediate values for ASCUS and LSIL thereby
emphasising the biological evolution between
benign and high grade lesions. These findings
reinforce the utility of GLCM texture parameters
for quantitative and objective analysis of these
grey zone lesions on cervical cytology. Adopting
GLCM in screening protocols can influence triage
decisions, reduce false negatives and align with
national goals of cancer elimination. [7, 8]
The findings of the
present study indicate that GLCM texture analysis
is a more objective tool and can be used as an
adjunct to routine cytological evaluation for
screening cervical lesions. The objective nature
of these parameters indicates good reproducibility
and reduced interobserver variability. Since the
parameters are numerical in nature, they can be
superlatively incorporated into the computer
assisted diagnostic algorithm and artificial
intelligence models. The study provides a cost
effective and easily interpretable tool that can
be easily integrated into the newer AI based
screening and diagnostic models without
requirement of high end equipment like whole slide
imaging. This application paves way for
implementation of automated screening system in
resource constrained settings in rural India.
Nevertheless,
several limitations exists for application of this
system in routine reporting which includes
standardization in image acquisition, image
quality, precision in segmentation, manual
selection of area of interest and annotation of
large datasets. Furthermore, large scale data
validation is must before it is adopted in routine
practice. Similarly, single centre study and
modest sample size limits its generalization.
References
- Sung H, Ferlay J, Siegel RL et al. Global
cancer statistics 2020: GLOBOCAN estimates of
incidence and mortality worldwide for 36 cancers
in 185 countries. CA Cancer J Clin.
2021;71(3):209-49.
- Schiffman M, Castle PE, Jeronimo J, Rodriguez
AC, Wacholder S. Human papillomavirus and
cervical cancer. Lancet.
2007;370(9590):890-907.
- Nayar R, Wilbur DC, editors. The Bethesda
System for Reporting Cervical Cytology:
Definitions, Criteria, and Explanatory Notes.
3rd ed. Cham: Springer; 2015.
- Davey DD, Neal MH, Wilbur DC, Colgan TJ, Styer
PE, Mody DR. Bethesda 2001 implementation and
reporting rates: 2003 practices of participants
in the College of American Pathologists
Interlaboratory Comparison Program in
Cervicovaginal Cytology. Arch Pathol Lab
Med. 2004;128:1224-9.
- Janowczyk A, Madabhushi A. Deep learning for
digital pathology image analysis: A
comprehensive tutorial with selected use cases.
Nat Rev Clin Oncol. 2016;13(3):183-98.
- Elazab N, Gab Allah W, Elmogy M. Deep learning
for cervical cancer diagnosis: advances and
challenges. Cancer Control.
2024;31:10732748241234567.
- Win KP, Kitjaidure Y, Hamamoto K, Aung TM.
Computer-assisted screening for cervical cancer
using digital image processing of Pap smear
images. Appl Sci (Basel). 2020;10(5):1800.
- Haralick RM, Shanmugam K, Dinstein I. Textural
features for image classification. IEEE
Trans Syst Man Cybern.
1973;SMC-3(6):610-21.
- Zink D, Fischer AH, Nickerson JA. Nuclear
structure in cancer cells. Nat Rev Cancer.
2004;4(9):677-87.
- Prieto BE, Rodríguez VJO, Correa HSC, Soracipa
MMY. Diagnosis of cervical cells based on
fractal and Euclidean geometrical measurements:
intrinsic geometric cellular organization.
BMC Med Phys. 2014;14:2.
- Adam RL, Silva RC, Pereira FG, Leite NJ,
Lorand-Metze I, Metze K. The fractal dimension
of nuclear chromatin as a prognostic factor in
acute precursor B lymphoblastic leukemia. Cell
Oncol. 2006;28(1-2):55-59.
doi:10.1155/2006/409593.
- Amita K, Kalappa P, Rajini T. The usefulness
of gray image fractal analysis – An adjunct tool
for the diagnosis of breast lesions at cytology.
Journal of Microscopy and Ultrastructure.
2023. 10.4103/jmau.jmau_110_22.
- Castellano G, Bonilha L, Li LM, Cendes F.
Texture analysis of medical images. Clin
Radiol. 2004;59(12):1061-9.
|


