|
Introduction
Malnutrition
remains a major global public health concern,
threatening child's survival and their ability to
thrive.[1,2] Childhood nutritional deficiencies
may trigger cognitive impairments, hinder academic
performance and reduce productivity.[3,4] Joint
child malnutrition estimates, 2022 reported that
22% of children under five were stunted and 7%
were wasted, with more than 90% of the burden
concentrated in Asia and Africa.[5] According to
the Global Hunger Index (2025), which measures
hunger using indicators such as undernourishment,
child stunting, child wasting, and under-five
mortality, India ranks 102nd among 123
countries with a score of 25.8, placing it in the
‘serious category’.[6] In India, NFHS-5 data
indicates that 32.1% children under five years of
age were underweight, 19.3% were wasted, and 35.5%
were stunted.[7] The situation among tribal
children is even more concerning, with 40.9%
stunted, 23.2% wasted, and 39.5% underweight.[7]
Major risk factors responsible for high
undernutrition prevalence among tribal children
include socioeconomic, cultural, environmental and
political factors such as economic instability,
poverty, parental unemployment, parental
education, maternal nutrition, faulty feeding
practices, traditional beliefs, poor hygiene and
lack of ration cards.[8–16]
Malnutrition among
children under five years of age is commonly
assessed using anthropometric indicators such as
stunting (low height-for-age), underweight (low
weight-for-age), and wasting (low
weight-for-height).[17] However, these indicators
often overlap to varying degrees. For example,
some underweight children may also be stunted
and/or wasted, while some stunted children can
also be underweighted, and others may experience
all three forms of anthropometric failure
simultaneously i.e. stunting, wasting, and
underweight. Consequently, using any one of these
conventional indicators alone does not fully
capture the overall burden of undernutrition.
In 2000, Swedish
economist Professor Peter Svedberg proposed an
alternative indicator to estimate the overall
burden of undernutrition: the Composite Index of
Anthropometric Failure (CIAF).[18,19] Svedberg
proposed six subgroups: Group A (no failure),
Group B (wasting only), Group C (wasting and
underweight only), Group D (wasting, stunting, and
underweight), Group E (stunting and underweight),
and Group F (stunting only).[18] Later, Nandy et
al.[20] expanded this framework by introducing an
additional subgroup, Group Y (underweight only).
Subsequently, Kuiti and Bose[21] added Group G
(stunting with overweight) and Group H (overweight
only). More recently, Mahapatra and Bose[22]
proposed Category I, representing children who are
stunted and wasted but not underweight (Table 1).
The CIAF provides an actual burden of
undernutrition by classifying children into
specific subgroups, allowing for a more
comprehensive analysis of the interrelationships
among various forms of undernutrition.[22] The
present study aims to assess undernutrition using
conventional anthropometric indices alongside CIAF
among the Korku children under five years of age
in the Melghat region of Maharashtra.
|
Table 1: Classification of
children with anthropometric failure
assessed by CIAF
|
|
Group Name
|
Description
|
Wasting
|
Stunting
|
Underweight
|
Overweight
|
|
A
|
No failure
|
No
|
No
|
No
|
No
|
|
B
|
Wasting only
|
Yes
|
No
|
No
|
No
|
|
C
|
Wasting and underweight
|
Yes
|
No
|
Yes
|
No
|
|
D
|
Wasting, stunting and underweight
|
Yes
|
Yes
|
Yes
|
No
|
|
E
|
Stunting and underweight
|
No
|
Yes
|
Yes
|
No
|
|
F
|
Stunting only
|
No
|
Yes
|
No
|
No
|
|
G
|
Stunting and overweight
|
No
|
Yes
|
No
|
Yes
|
|
H
|
Overweight only
|
No
|
No
|
No
|
Yes
|
|
I
|
Stunting and wasting only
|
Yes
|
Yes
|
No
|
No
|
|
Y
|
Underweight only
|
No
|
No
|
Yes
|
No
|
|
Classification based on Mahapatra and
Bose (2024).[22]
|
Materials and Methods
Study design
The present
community-based cross-sectional study was carried
out from October 2023 to February 2024 among
under-five Korku tribal children residing in
Melghat region of Amravati district, Maharashtra,
India. Melghat region comprises of Chikhaldara and
Dharni tahsils. The area is covered with a dense
forest and primarily inhabited by the Korku tribe.
According to 2011 census, the total population of
Melghat region is 3,03,480 persons (1,54,621 males
and 1,48,859 females). Scheduled tribes comprised
2, 35,241 persons (1,19,313 males and 1,15,928
females) which is 77.5 % of the total population
of Melghat. Korku are the
largest indigenous group in Melghat. They belong
to Munda subgroup and primarily speak Korku
language which is a part of the Austro-Asiatic
language family.[23,24] Their livelihood is
primarily based upon agriculture, livestock, and
forest products.
Sample Size and Sampling Method
The minimum sample
size for the present study was estimated as 366
individuals using the single population proportion
formula.[25] A stratified random sampling method
was used to select villages having more than 80%
tribal population. Further, study participants
were purposively selected. Accordingly, the study
was conducted among 384 Korku children under 5
years of age (192 boys and 192 girls) from
Chikhaldara and Dharni blocks of Melghat, Amravati
district, Maharashtra, India.
Inclusion and Exclusion Criteria
Healthy children
from the Korku tribal community who i) were aged
0-5 years ii) had authentic vaccination card as a
record of their date of birth were included in the
study. Children were excluded if they: (i) had any
chronic illness affecting their nutritional
status, or (ii) were born with congenital
anomalies, or (iii) were born extremely premature
(less than 28 weeks of gestational age).
Ethical Clearance and Participation
Consent
The study received
ethical clearance from the Institutional Ethics
Committee (IEC) of the Sikkim University, ensuring
compliance with all relevant guidelines for
research involving human participants. The
objectives of the study were explained to the
mothers before anthropometric measurements were
taken. Data were collected after obtaining verbal
consent from mothers of under‑five children using
a structured interview schedule.
Anthropometric Measurements
Anthropometric
measurements such as height and weight were taken
following the standard procedure accurate to the
nearest 0.1 cm and 0.5 kg, respectively.[26,27]
The height and weight of children younger than 2
years were measured using an infantometer and a
hanging weighing scale, respectively. For children
aged 2 years and above, height was measured using
a stadiometer and weight was recorded using a
weighing machine.
Assessment of Nutritional Status
Based on
anthropometric measurements, Z scores for
height-for-age (HAZ), weight-for-age (WAZ), and
weight-for-height (WHZ) were computed using Anthro
software version 3.2.2. Children were classified
as underweight (WAZ <-2 SD), stunted (HAZ
<-2 SD), or wasted (WHZ <-2 SD) according to
WHO standards[28], with severe undernutrition
defined as WAZ, HAZ, or WHZ <-3 SD and moderate
undernutrition as scores between -3 and -2 SD. The
CIAF was computed using the modified categories
proposed by Mahapatra and Bose22 (Table
1).
Statistical Analysis
Anthropometric
variables were analyzed statistically using STATA
software version 15. Chi-square (χ²) tests were
used for assessing sex-specific differences in the
prevalence of undernutrition based on conventional
anthropometric indices and CIAF. A p-value
<0.05 was considered statistically significant.
Independent samples t-tests were used to assess
differences in mean anthropometric measurements
across ages and sexes, with p-values reported to
indicate statistical significance (p < 0.05).
Euler plot and alluvial plot were prepared using
R-studio software.
Results
A total of 384 children were evaluated for their
nutritional status, with an equal distribution of
boys (50%, n=192) and girls (50%, n=192). The mean
age of studied children was 24.7 ± 14.9 months.
|
Table 2: Comparison of
Anthropometric Indicators and Z-Scores
Between Boys and Girls (N=384)
|
|
Indicator
|
0-23 months (n=202)
|
24-59 months (n=182)
|
t
|
p
|
Girls (n=192)
|
Boys (n=192)
|
t
|
p
|
|
Weight (kg)
|
7.72 ± 2.00
|
11.53 ± 1.94
|
-18.89
|
0.00***
|
9.32 ±2.72
|
9.73 ± 2.75
|
1.47
|
0.14
|
|
Height (cm)
|
69.81 ± 9.58
|
87.51 ± 8.04
|
-19.49
|
0.00***
|
77.37 ± 12.45
|
79.04 ± 12.59
|
1.31
|
0.19
|
|
WHZ- Wasting
|
0.17 ± 0.38
|
0.13 ± 0.33
|
1.15
|
0.25
|
0.09 ± 0.29
|
0.19 ± 0.39
|
2.74
|
0.006**
|
|
HAZ- Stunting
|
0.52 ± 0.50
|
0.57 ± 0.49
|
-0.92
|
0.36
|
0.53 ± 0.50
|
0.57 ± 0.50
|
0.82
|
0.41
|
|
WAZ-Underweight
|
0.42 ± 0.49
|
0.40 ± 0.49
|
0.29
|
0.77
|
0.35 ± 0.48
|
0.46 ± 0.49
|
2.19
|
0.02*
|
|
(p< 0.05(*) p<
0.01(**) p< 0.001(***)
|
The mean weight was
higher in boys than girls (9.73 ± 2.75 kg vs.9.32
± 2.7 kg) (Table 2). Mean height followed the
similar pattern (79.04 ± 12.59 cm vs. 77.37 ±
12.45 cm). Sex-differences in both height and
weight were not statistically significant. Mean
height and weight increased across age groups,
showing a linear pattern. As age increased,
children became taller and heavier (0-23 months:
height 69.81 ± 9.58 cm, weight 7.72 ± 2.00 kg;
24-59 months: height 87.51 ± 8.04 cm, weight 11.53
± 1.94 kg). Differences across age groups were
statistically significant for both height and
weight (height t= -19.49, p< 0.001;
weight t = -18.89, p< 0.001) (Table
2).
Independent samples
t-tests showed statistically significant sex
differences across wasting and underweight
categories (p > 0.05) (Table 2). The mean
prevalence for wasting and underweight was
slightly higher among younger age group (wasting:
0.17 ± 0.38 vs 0.13 ± 0.33; underweight: 0.42 ±
0.49 vs. 0.40 ± 0.49). Whereas, the mean
prevalence of stunting (HAZ) was higher in older
age groups (0.57 ± 0.49 vs. 0.52 ± 0.50). The
differences by age were not statistically
significant for any anthropometric indicators.
|
Table 3: Prevalence of
Nutritional status using CIAF and
conventional anthropometric indices
among the under five children of Korku
Tribal Community
|
|
Categories
|
Age
|
Age differences (χ2-value)
|
Sex
|
Age-Sex Combined
|
Sex difference (χ2-value)
|
|
0-23 months (n=202)
|
24-59 months (n=182)
|
Boys
|
Girls
|
|
(n=192)
|
(n=192)
|
|
n
|
%
|
n
|
%
|
n
|
%
|
n
|
%
|
n
|
%
|
|
|
Nutritional Status based on CIAF
|
|
|
No failure (A)
|
68
|
33.7
|
56
|
30.8
|
13.21 (0.11)
|
55
|
28.65
|
69
|
35.94
|
124
|
32.3
|
17.31 (0.027*)
|
|
Wasting only (B)
|
9
|
4.5
|
3
|
1.7
|
10
|
5.2
|
2
|
1.0
|
12
|
3.1
|
|
Wasting and underweight (C)
|
8
|
4.0
|
11
|
6.0
|
12
|
6.3
|
7
|
3.7
|
19
|
4.9
|
|
Wasting, underweight & stunting (D)
|
17
|
8.4
|
9
|
5.0
|
16
|
8.3
|
10
|
5.2
|
26
|
6.8
|
|
Stunting and underweight (E)
|
53
|
26.2
|
44
|
24.2
|
56
|
29.2
|
41
|
21.4
|
97
|
25.3
|
|
Stunting only (F)
|
29
|
14.4
|
45
|
24.7
|
33
|
17.2
|
41
|
21.4
|
74
|
19.3
|
|
Stunting and overweight (G)
|
7
|
3.5
|
6
|
3.3
|
4
|
2.1
|
9
|
4.7
|
13
|
3.4
|
|
Overweight only (H)
|
5
|
2.5
|
1
|
0.6
|
2
|
1.0
|
4
|
2.1
|
6
|
1.6
|
|
Stunting and wasting only (I)
|
0
|
0.0
|
0
|
0.0
|
0
|
0
|
0
|
0.0
|
0
|
0.0
|
|
Underweight only (Y)
|
6
|
3.0
|
7
|
3.9
|
4
|
2.1
|
9
|
4.7
|
13
|
3.4
|
|
Anthropometric Failure (CIAF)
(B+C+D+E+F+G+H+I+Y)
|
134
|
66.3
|
126
|
69.2
|
|
137
|
71.4
|
123
|
64.1
|
260
|
67.7
|
|
|
Nutritional Status based on
Conventional (Single) Anthropometric
Index
|
|
|
Weight-for-Age (WAZ)
|
|
|
Severely underweight (<-3 SD)
|
28
|
13.9
|
20
|
11.0
|
0.72 (0.4)
|
30
|
15.6
|
18
|
9.4
|
48
|
12.5
|
3.428 (0.6)
|
|
Moderately Underweight (-3 SD to <-2
SD)
|
57
|
28.2
|
53
|
29.1
|
0.038 (0.8)
|
59
|
30.7
|
51
|
26.6
|
110
|
28.6
|
0.815 (0.4)
|
|
Underweight (below -2 SD)
|
85
|
42.1
|
73
|
40.1
|
0.09 (0.8)
|
89
|
46.4
|
69
|
35.9
|
157
|
40.9
|
4.75 (0.03)*
|
|
Normal (-2 SD to +1 SD)
|
117
|
57.9
|
109
|
59.9
|
0.15 (0.7)
|
103
|
53.7
|
123
|
64.1
|
227
|
59.1
|
4.30 (0.04)*
|
|
Height/length-for-Age (HAZ)
|
|
|
Severely stunted (<-3 SD)
|
53
|
26.2
|
49
|
26.9
|
0.023 (0.9)
|
55
|
28.7
|
47
|
24.5
|
102
|
26.6
|
0.854 (0.355)
|
|
Moderately Stunted (-3 SD to <-2SD)
|
54
|
26.7
|
55
|
30.2
|
0.57 (0.5)
|
54
|
28.1
|
55
|
28.7
|
109
|
29.4
|
0.013 (0.91)
|
|
Stunted (below -2 SD)
|
107
|
53.0
|
104
|
57.1
|
0.84 (0.4)
|
109
|
56.8
|
102
|
53.1
|
210
|
54.7
|
0.67 (0.41)
|
|
Normal (-2 SD to +3 SD)
|
95
|
47.0
|
78
|
42.9
|
0.67 (0.4)
|
83
|
43.2
|
90
|
46.9
|
174
|
45.3
|
0.5 (0.5)
|
|
Weight-for-Height (WHZ)
|
|
|
Severely wasted (<-3 SD
|
7
|
3.5
|
7
|
3.9
|
0.039 (0.8)
|
6
|
3.1
|
8
|
4.2
|
14
|
3.6
|
0.296 (0.6)
|
|
Moderately Wasted (-3 SD to <-2 SD)
|
27
|
13.4
|
16
|
8.8
|
2.015 (0.2)
|
32
|
16.7
|
11
|
5.7
|
43
|
11.2
|
11.549 (0.001)***
|
|
Wasted (below -2 SD)
|
34
|
16.8
|
23
|
12.6
|
1.33 (0.2)
|
38
|
19.8
|
19
|
9.9
|
57
|
14.8
|
7.4 (0.006)**
|
|
Normal (-2 SD to +1 SD)
|
168
|
83.2
|
159
|
87.4
|
1.3 (0.2)
|
154
|
80.2
|
173
|
90.1
|
327
|
85.2
|
7.4 (0.006)**
|
|
Sex and age difference statistically
significant at *p<0.05; p<0.01; p<
0.005
|
Table 3 presents age
and sex-specific, as well as overall, prevalence
of conventional anthropometric indicators and
CIAF. The overall prevalence of underweight,
stunting, wasting and CIAF was 40.9%, 54.7%, 14.8%
and 67.7%, respectively. It was observed that boys
were more affected by underweight (46.4% vs.
35.9%), severe underweight (15.6% vs. 9.4%),
moderately underweight (30.7% vs. 26.6%), stunting
(56.8% vs. 53.1%), severe stunting (28.7% vs.
24.5%), wasting (19.8% vs. 9.9%), and moderate
wasting (16.7% vs. 5.7%). The girls were slightly
more affected by moderate stunting and severe
wasting than boys (moderate stunting: 28.7% vs.
28.1%; severe wasting 4.2% vs. 3.1%)
Age wise
distribution of undernutrition categories reveled
that younger age group (0-23 months) experienced
more prevalence of underweight (42.1% vs. 40.1%),
severe underweight (13.9% vs. 11.0%), wasting
(16.8% vs. 12.6%), and moderate wasting (13.4% vs.
8/.8%). Whereas, severe form of wasting was higher
(3.9% vs. 3.5%) in the older age group (24-59
months). The older age group (24-59 months) also
experienced higher prevalence of moderate
underweight (29.1% vs. 28.2%), severe stunting
(26.9% vs. 26.2%), moderate stunting (30.2% vs.
26.7%), and overall stunting (27.1% vs. 53.0%).
Pearson’s chi-square test indicated that there is
no significant association between age group and
any anthropometric indicators.
The association
between sex and being underweight was
statistically significant χ² = 4.75, df = 1, p =
0.03), reflecting a higher burden among boys
(46.4% vs 35.9%). A statistically significant
difference was observed between sex and moderate
as well as overall wasting (p<0.01)
Assessment of
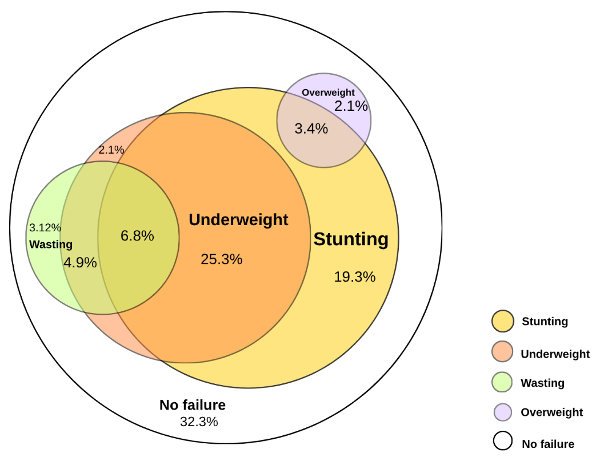
nutritional status using CIAF showed that stunting
and underweight (E) was the most prevalent CIAF
category, affecting 25.3% of children, followed by
stunting only (F), affecting 19.3% of children.
There was no prevalence of stunting and wasting
only (I) category. In the single anthropometric
failure categories overweight only (H), wasting
only (B), stunting and overweight (G), and
underweight only (Y) showed the lowest prevalence
of 1.6%, 3.1%, 3.4%, and 3.4% respectively.
Multiple anthropometric failure categories such as
stunting and overweight (G), wasting and
underweight (C), wasting, underweight and stunting
(D) showed similar prevalence pattern (3.4%, 4.9%,
6.8%, 3.4% respectively). Euler plot shows the
distribution and overlaps of anthropometric
indicators.
|
| Figure 1: Euler plot
showing distribution and overlap of child
undernutrition indicators: stunting,
underweight, and wasting |
The overall
prevalence of anthropometric failure was higher
among boys than girls (71.4% vs. 64.1%). Boys
showed higher prevalence among all anthropometric
failure categories except for stunting and
overweight (G), overweight only (H) and
underweight only (Y).
Pearson’s chi-square
test showed a significant association between sex
and CIAF category (χ2 = 17.31, df= 8, p = 0.027).
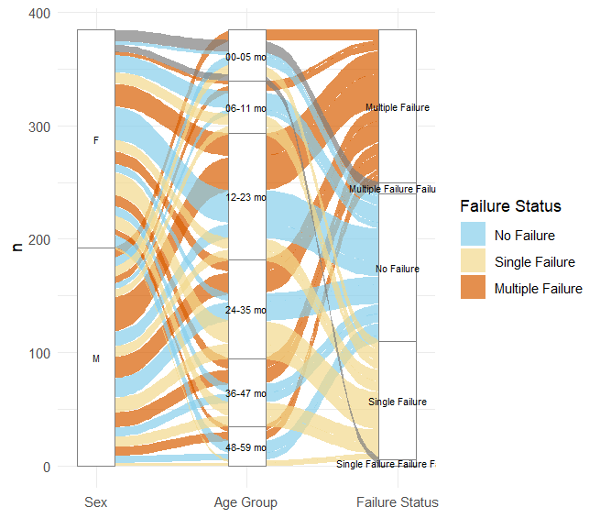
Alluvial plot shows the distribution of boys and
girls across age groups by CIAF status (no failure
vs single anthropometric failure and double
anthropometric failure) (Figure 2).
|
| Figure 2: Alluvial plot
depicting the distribution of boys and
girls across age groups by CIAF status.
Flows represent transitions between age
categories and CIAF classifications (no
failure, single anthropometric failure and
multiple anthropometric failures) |
Discussion
The use of the CIAF
in this community-based cross-sectional study
underscores several conceptual and practical
advantages over single-indicator approaches. More
than half of the children (67.7%) were classified
as experiencing anthropometric failures according
to CIAF. Notably multiple anthropometric failures
(40.4%) were more common than single
anthropometric failures (27.4%). This finding
indicates that a substantial proportion of
undernourished children suffer from more
nutritional deficits, highlighting the complexity
and severity of undernutrition within the study
population. The findings support the study
hypothesis that the burden of undernutrition is
substantially higher when assessed through CIAF
compared with conventional anthropometric
indicators alone.
The prevalence of
CIAF observed in the present study was lower than
that reported in the previous study conducted in
the same geographical region (Table 4).[29]
Although both studies were undertaken in a tribal
setting, pervious study included children from
multiple tribal communities, whereas the present
study focused exclusively on children belonging to
Korku tribal group.[29] Differences in the
prevalence could be attributable to variations in
the socio-economic, cultural and dietary diversity
that may exist among different tribal communities.
This observation highlights the importance of
recognizing that tribal populations are not
homogenous and nutritional outcomes may vary
between individual tribes. Furthermore, the time
interval of more than 10 years between the two
studies may have contributed to the lower
prevalence observed in the present study. The
lower prevalence could be due to implementation of
several initiatives such as Integrated Child
Development Services (ICDS), POSHAN Abhiyaan,
Rajmata Jijau Mission, National Health Mission
(NHM), Mission Vatsalya, Saksham Anganwadi, and
Mission Indradhanush aimed at improving maternal
and child health, nutritional supplementation,
immunization coverage, sanitation, and access to
healthcare services. The overall prevalence of
CIAF in our study is higher than the prevalence
among under-five children in Nagpur, Mumbai and
Palghar districts of Maharashtra.[30–32] When
compared with studies conducted outside
Maharashtra, the CIAF prevalence in our study was
lower than that reported from Medinipur, West
Bengal (76.9%)[33] but higher than the prevalence
observed in other studies.[22,31,32,34–40] (Table
4)
The present study
observed a higher prevalence of CIAF among boys
compared to girls. This finding is consistent with
studies conducted among under-five children of
Maharashtra, West Bengal, Chhattisgarh, and
Odisha, India. [22,32,35,38,40] However,
contrasting findings have been reported among
under-five children of Kachari tribe of Assam,
India and under-five children of Jangalmahal
districts of India, who found a higher prevalence
of anthropometric failure among girls.[34,39] The
inconsistencies in findings across studies may be
attributable to differences in study populations,
geographical settings, socio-economic conditions,
cultural practices and sample characteristics of
the children studied. Variations in access to
food, healthcare utilization, caregiving
practices, and local gender norms may also
influence nutritional outcomes differently across
communities. Furthermore, the study identified a
significant association between sex and
anthropometric failure categories along with
overall anthropometric failure. Similar results
were reported in previous studies.[22,34,36] The
comparison of CIAF categories across different
studies revealed considerable variation in the
pattern of anthropometric failure. Despite these
differences, several common trends emerged. In
most studies, and in the present investigation,
category E (Stunting only) constituted highest
proportion of anthropometric failure.[29–33,39]
which indicates co-existence of multiple forms of
nutritional deprivation. A substantial proportion
of children were also classified under category F
(Stunting only). This finding suggest that chronic
undernutrition remains predominant nutritional
challenge across different
populations.[22,34,36–38,40] In contrast,
categories representing acute forms of
undernutrition, such as Category B (wasting only)
and Category C (wasting with underweight),
generally accounted for a smaller proportion of
children in most studies including our
study.[22,29–31,33,34,36,37,39,40] This pattern
may indicate that chronic nutritional deprivation
contributes more substantially to anthropometric
failure than short-term nutritional deficits.
However, some studies reported relatively higher
prevalence of wasting related categories,
suggesting possible regional differences in food
availability, disease burden, lifestyle
differences or environmental conditions.[32,35,38]
Notably, 6.8% of children in the present study
were classified under Category D, which indicates
the coexistence of stunting, wasting, and
underweight. This category identifies children
experiencing multiple anthropometric failures and
therefore at a higher risk of adverse health
outcomes. The relatively high prevalence of
Category D emphasizes the importance of using
CIAF, as conventional indicators assessed
separately may fail to adequately capture the
extent of overlapping nutritional deficits within
the population.
|
Table 4: Comparative prevalence
of CIAF among Indian children
|
|
Author
|
Year
|
Age-group (in years)
|
Sample size
|
Study Area
|
Aa
|
Bb
|
Cc
|
Dd
|
Ee
|
Ff
|
Gg
|
Hh
|
Ii
|
Yy
|
B-Yz
(CIAF)
|
|
Talapalliwar et al.
|
2014
|
0-6
|
540
|
Maharashtra
|
23.7
|
0.4
|
5.5
|
13.0
|
38.7
|
15.0
|
NR
|
NR
|
NR
|
3.7
|
76.3
|
|
Dhok and Thakre
|
2016
|
0-5
|
256
|
Maharashtra
|
41.4
|
2.7
|
8.2
|
4.3
|
19.9
|
10.6
|
NR
|
NR
|
NR
|
12.9
|
58.6
|
|
Bharali et al.
|
2019
|
0-5
|
362
|
Assam
|
51.4
|
4.7
|
4.9
|
1.9
|
13.3
|
20.9
|
NR
|
NR
|
NR
|
2.8
|
48.6
|
|
Bahuguna et al.
|
2021
|
0-5
|
6489
|
Maharashtra
|
47.7
|
1.7
|
3.7
|
6.0
|
23.1
|
14.8
|
NR
|
NR
|
NR
|
3.0
|
52.3
|
|
Jeyakumar et al.
|
2021
|
0-5
|
577
|
Maharashtra
|
41.2
|
14.9
|
4
|
7.5
|
25.8
|
5.0
|
NR
|
NR
|
NR
|
1.6
|
58.8
|
|
Dhansay et al.
|
2022
|
0-5
|
182
|
Chhattisgarh
|
48.4
|
3.3
|
3.3
|
4.4
|
11
|
24.7
|
NR
|
NR
|
NR
|
4.9
|
51.6
|
|
Khanra et al.
|
2022
|
2-5
|
303
|
West Bengal
|
30.0
|
3.0
|
3.8
|
21.4
|
45.9
|
18.8
|
NR
|
NR
|
NR
|
6.8
|
76.9
|
|
Biswas and Khatun
|
2023
|
2-5
|
607
|
West Bengal,
|
53.4
|
7.4
|
15.2
|
6.3
|
10.9
|
2.6
|
NR
|
NR
|
NR
|
4.3
|
46.6
|
|
Mohandas et al.
|
2023
|
0-5
|
310
|
Telangana
|
60.3
|
1.6
|
7.7
|
2.3
|
7.1
|
11.3
|
NR
|
NR
|
NR
|
9.7
|
39.6
|
|
Kumari et al.
|
2024
|
6m-5
|
550
|
Odisha
|
42.0
|
3.1
|
12.2
|
7.1
|
14.2
|
19.6
|
NR
|
NR
|
NR
|
1.8
|
58.0
|
|
Mahanti et al.
|
2024
|
2-6
|
497
|
West Bengal
|
49.1
|
2.8
|
7.7
|
6.0
|
17.1
|
8.5
|
-
|
4.6
|
-
|
4.2
|
50.9
|
|
Mahapatra and Bose
|
2024
|
1-6
|
848
|
West Bengal
|
41.0
|
7.3
|
4.8
|
12.9
|
9.3
|
23.9
|
-
|
-
|
0.7
|
-
|
59.0
|
|
Biswas et al.
|
2025
|
1-5
|
1057
|
Assam
|
41.2
|
1.5
|
6.3
|
6.3
|
16.3
|
27.8
|
NR
|
NR
|
NR
|
0.5
|
58.8
|
|
Present Study
|
2026
|
0-5
|
384
|
Maharashtra
|
32.3
|
3.1
|
4.9
|
6.8
|
25.3
|
19.3
|
3.4
|
1.6
|
0.0
|
3.4
|
67.7
|
|
*NR-Not reported; a No
failure; b Wasting only; c
Wasting and underweight; d Wasting,
underweight and stunting; e Stunting
and underweight; f Stunting
only; g Stunting and
overweight; h Overweight
only; I Stunting and wasting
only; y Underweight only; z
Anthropometric Failure (CIAF)
|
The comparison of
conventional anthropometric indicators across
studies revealed substantial variation in the
prevalence of stunting, wasting, and underweight
(Table 5). In the present study stunting (54.7%)
was the most prevalent form of undernutrition,
followed by underweight (40.9%) wasting (14.8%). A
similar pattern where stunting consistently
emerged as the predominant anthropometric deficit
was reported in previous
studies.[22,29,30,32–34,36,38,40]
Although
conventional anthropometric indicators are useful
for identifying specific forms of undernutrition,
they evaluate each nutritional deficit separately
and may overlook children experiencing multiple
anthropometric failures. In the present study, the
prevalence of CIAF exceeded that of any individual
conventional indicator, suggesting that a
considerable proportion of children suffered from
overlapping forms of undernutrition. This
observation highlights the limitations of relying
solely on conventional indicators and supports the
use of CIAF as a more comprehensive measure of the
overall burden of anthropometric failure.
|
Table 5: Comparative prevalence
of conventional anthropometric indices
|
|
Author
|
Year
|
Age-group (in years)
|
Sample size
|
Study Area
|
Conventional Anthropometric Index
|
|
Underweight
|
Stunting
|
Wasting
|
|
Talapalliwaret al.
|
2014
|
0-6
|
540
|
Maharashtra
|
60.9
|
66.4
|
18.8
|
|
Dhok and Thakre
|
2016
|
0-5
|
256
|
Maharashtra
|
45.3
|
34.8
|
15.2
|
|
Bharali et al.
|
2019
|
0-5
|
362
|
Assam
|
22.9
|
36.2
|
11.6
|
|
Bahuguna et al.
|
2021
|
0-5
|
6489
|
Maharashtra
|
44.0
|
35.7
|
11.4
|
|
Jeyakumar et al.
|
2021
|
0-5
|
577
|
Maharashtra
|
43
|
48.4
|
13.0
|
|
Dhansay et al.
|
2022
|
0-5
|
182
|
Chhattisgarh
|
24.2
|
40.1
|
11.0
|
|
Khanra et al.
|
2022
|
2-5
|
303
|
West Bengal
|
57.1
|
65.0
|
20.5
|
|
Biswas and Khatun
|
2023
|
2-5
|
607
|
West Bengal,
|
36.6
|
19.8
|
28.8
|
|
Mohandas et al.
|
2023
|
0-5
|
310
|
Telangana
|
24.5
|
16.5
|
10.6
|
|
Kumari et al.
|
2024
|
6m-5
|
550
|
Odisha
|
37.4
|
40.7
|
22.4
|
|
Mahanti et al.
|
2024
|
2-6
|
497
|
West Bengal
|
35.0
|
31.6
|
16.5
|
|
Mahapatra and Bose
|
2024
|
1-6
|
848
|
West Bengal
|
27.0
|
46.8
|
25.7
|
|
Biswas et al.
|
2025
|
1-5
|
1057
|
Assam
|
29.4
|
50.5
|
14.2
|
|
Present Study
|
2026
|
0-5
|
384
|
Maharashtra
|
40.9
|
54.7
|
14.8
|
Limitations
The present study
focused specifically on tribal children belonging
to the Korku community in Melghat region of
Maharashtra. Therefore, findings may not represent
overall situation of tribal populations of the
Maharashtra state. However, a major strength of
the study is that, according to the 2011 Census,
the Korku community in Maharashtra is
predominantly concentrated in the Melghat region.
Hence, the study findings may reasonably reflect
the situation of Korku tribal children in
Maharashtra. The cross-sectional nature of the
present study is another limitation, as
nutritional status of children was assessed at
only one point in time. Therefore, temporal
changes in nutritional status could not be
evaluated. Thus, future longitudinal studies are
needed to evaluate the effectiveness of
interventions aimed at reducing childhood
malnutrition.
Conclusion
In conclusion the
present study shows high prevalence of
undernutrition among the under-five children of
Korku tribal community of Maharashtra. The burden
of undernutrition is substantially higher when
assessed through CIAF compared with conventional
anthropometric indicators alone. Thus, the present
study highlights the limitations of relying solely
on conventional indicators and supports the use of
CIAF as a more comprehensive measure of the
overall burden of anthropometric failure. The CIAF
provides a holistic overview of nutritional status
by assessing varying degrees of undernutrition as
well as overnutrition among children. It can help
researchers, healthcare providers, and policy
makers to better understand the overall burden of
malnutrition and facilitate the development of
targeted interventions and strategies to improve
child health.
Acknowledgement
The authors express sincere gratitude to the
mothers of the participating children for their
kind cooperation during the study.
Declarations
The authors declare that they have no conflict of
interest.
References
- Black RE, Allen LH, Bhutta ZA, et al. Maternal
and child undernutrition: global and regional
exposures and health consequences. The
Lancet. 2008;371(9608):243-260.
doi:10.1016/S0140-6736(07)61690-0
- World Health Organization. Malnutrition. 2023.
Accessed April 15, 2026. Available at https://www.who.int/health-topics/malnutrition
- Victora CG, Adair L, Fall C, et al. Maternal
and child undernutrition: consequences for adult
health and human capital. The lancet.
2008;371(9609):340-357.
doi:10.1016/S0140-6736(07)61692-4
- Maulidya R, Zulfan Z, Nadya S, Zahara A.
Factors influencing the nutritional status of
children aged 6–23 months based on the Composite
Index of Anthropometric Failure (CIAF). AcTion:
Aceh Nutrition Journal.
2025;10(1):168-182.
doi:10.30867/action.v10i1.2094
- World Health Organization, The Joint Child
Malnutrition Estimates (JME). Levels and Trends
in Child Malnutrition Child Malnutrition:
UNICEF/WHO/World Bank Group Joint Child
Malnutrition Estimates: Key Findings of the 2023
Edition. Vol 24. World Health Organization;
2023.
- Global Hunger Index. Global Hunger Index.
Global Hunger Index Scores by 2025 GHI Rank.
2025. Accessed May 20, 2026. Available at https://www.globalhungerindex.org/ranking.html
- IIPS. India national family health survey
NFHS-5 2019-21. International Institute for
Population Sciences (IIPS), Mumbai, India.
Published online 2022.
- Rao VG, Yadav R, Dolla CK, Kumar S.
Undernutrition and childhood morbidities among
tribal preschool children. Indian journal
of Medical research. 2005;122(1):43-47.
- Islam S, Mahanta TG, Sarma R, Hiranya S.
Nutritional status of under 5 children belonging
to tribal population living in riverine (Char)
areas of Dibrugarh district, Assam. Indian
Journal of Community Medicine. 2014
Jul;39(3):169.
- Mitra M, Sahu PK, Chakrabarty S, Bharati S,
Bharati P. Nutritional and health status of Gond
and Kawar tribal pre-school children of
Chhattisgarh, India. Journal of Human
Ecology. 2007 Apr 1;21(4):293-9.
- Dani V, Satav A, Pendharkar J, et al.
Prevalence of under nutrition in under-five
tribal children of Melghat: A community based
cross sectional study in Central India. Clin
Epidemiol Glob Health. 2015;3(2):77-84.
doi:10.1016/j.cegh.2014.08.001
- Palaniappan S, Janakiraman EV, Suresh S.
Severe Acute Malnutrition in Tribal Under-Five
children in Javvadu Hills, Tamil Nadu. SSR
Institute of International Journal of Life
Sciences. 2022;8(1):2947-2952.
doi:10.21276/ssr-iijls.2022.8.1.3
- Mohan P, Agarwal K, Jain P. Child malnutrition
in Rajasthan: study of tribal migrant
communities. Econ Polit Wkly.
Published online 2016:73-81.
- Manjunath R, Kulkarni P, Begum K, et al.
Malnutrition among under-five children of
Kadukuruba tribe: Need to reach the unreached. Journal
of Clinical and Diagnostic Research.
2014;8(7):2-5. doi:10.7860/JCDR/2014/9436.4548
- Ghosh S, Varerkar SA. Undernutrition among
tribal children in Palghar district,
Maharashtra, India. PLoS One.
2019;14(2):1-14.
doi:10.1371/journal.pone.0212560
- Meshram II, Arlappa N, Balakrishna N,
Mallikharjuna Rao K, Laxmaiah A, Brahmam GNV.
Trends in the prevalence of undernutrition,
nutrient and food intake and predictors of
undernutrition among under five year tribal
children in India. Asia Pac J Clin Nutr.
2012;21(4):568-576.
- Williams J. WHO child growth standards. Dev
Med Child Neurol. 2009;51(12):1002.
- Svedberg P. Poverty and Undernutrition:
Theory, Measurement, and Policy. Clarendon
press; 2000. doi:10.1093/0198292686.001.0001
- Savanur MS, Ghugre PS. Magnitude of
undernutrition in children aged 2 to 4 years
using CIAF and conventional indices in the slums
of Mumbai city. J Health Popul Nutr.
2015;33(1):3. doi:10.1186/s41043-015-0017-x
- Nandy S, Irving M, Gordon D, Subramanian S V,
Smith GD. Poverty, child undernutrition and
morbidity: new evidence from India. Bull
World Health Organ. 2005;83:210-216.
- Kuiti BK, Bose K. The concept of composite
index of anthropometric failure (CIAF):
revisited and revised. Anthropology–Open
Journal. 2018;3(1):32-35.
doi:10.17140/antpoj-3-118
- Mahapatra B, Bose K. Anthropometric failure
and its associated factors among tribal
preschool children of West Bengal, India. Anthropology–Open
Journal. 2024;7(1):1-9.
doi:10.17140/ANTPOJ-7-134
- Grierson GA. Muṇḍā and Dravidian languages.
Calcutta: Office of the Superintendent of
Government Printing; 1906. (Linguistic Survey of
India; Vol. 4).
- Parkin R. A guide to Austroasiatic speakers
and their languages. Oceanic Linguistics
Special Publications. 1991;(23):i-198.
- Daniel WW. The Fisher exact test.
Biostatistics: a foundation for analysis in the
health sciences 7th ed New York: John Wiley and
Sons. Published online 1999:606-611.
- Weinner JS, Lourie JA. Practical Human Biology
IBP. London, Academic Press. Preprint posted
online 1981.
- Lee RD, Nieman DC. Nutritional Assessment.
McGraw-Hill New York; 2007.
- Organization WH. WHO Child Growth Standards:
Length/Height-for-Age, Weight-for-Age,
Weight-for-Length, Weight-for-Height and Body
Mass Index-for-Age: Methods and Development.
World Health Organization; 2006.
- Talapalliwar MR, Garg BS. Nutritional status
and its correlates among tribal children of
Melghat, Central India. The Indian Journal
of Pediatrics. 2014;81(11):1151-1157.
doi:10.1007/s12098-014-1358-y
- Dhok RS, Thakre SB. Measuring undernutrition
by composite index of anthropometric failure
(CIAF): a community-based study in a slum of
Nagpur city. Int J Med Sci Public Health.
2016;5(10):2013.
doi:10.5455/ijmsph.2016.07022016398
- Bahuguna M, Das S, Osrin D, Pantvaidya DrS,
Jayaraman A. Composite Index of Anthropometric
Failure and its correlates: a cross-sectional
study of under five children in an urban
informal settlement of Mumbai, India. Society
for Nutrition, Education and Health Action.
2021;(March):1-11. Available at https://snehamumbai.org/wp-content/uploads/2021/04/Composite-Index-of-Anthropometric-Failure-Report.pdf
- Jeyakumar A, Godbharle S, Giri BR.
Determinants of anthropometric failure among
tribal children younger than 5 years of age in
Palghar, Maharashtra, India. Food Nutr Bull.
2021;42(1):55-64. doi:10.1177/0379572120970836
- Khanra B, Pratihar S, Chanak M, Bose K.
Assessment of the Composite Index of
Anthropometric Failure (CIAF) among the Rural
Preschool Children of Medinipur, West Bengal.
Published online 2022.
https://ir.vidyasagar.ac.in/jspui/handle/123456789/7311
- Bharali N, Singh KN, Mondal N. Composite Index
of Anthropometric Failure (CIAF) among Sonowal
Kachari tribal preschool children of flood
effected region of Assam, India. Anthropological
Review. 2019;82(2):163-176.
doi:10.2478/anre-2019-0012
- Biswas A, Khatun A. Composite Index of
Anthropometric Failure among preschool children
under ICDS of Jalpaiguri District, West Bengal,
India. Antrocom: Online Journal of
Anthropology. 2023;19(1).
- Biswas S, Saha M, Bhattacharjee S, Bose K.
Nutritional status and its socio-economic
determinants− a study among Karbi tribal
children (under five years) of Karbi Anglong
district, Assam, India. J Hunger Environ
Nutr. 2025;20(6):1243-1261.
doi:10.1080/19320248.2025.2532138
- Mohandas A, Bhuchakra HP, Varma P, Pattnaik S.
Assessment of nutritional status using composite
index of anthropometric failure (CIAF) among
under-five children from an urban slum of
southern India: A cross-sectional study. National
Journal of Community Medicine.
2023;14(12):785-792.
doi:10.55489/njcm.141220233412
- Kumari T, Lenka C, Guru P. Assessment of
undernutrition among under-five children by
using composite index of anthropometric failure
(CIAF). South East Eur J Public Health.
2024;25(s1):2616-2628.
doi:10.70135/seejph.vi.2498
- Mahanti B, Chowdhury S, Paul S, et al.
Assessment by neo-CIAF formula predicts contrast
occurrence of overweight and undernourishment in
preschool children of Jangalmahal districts,
India. Trends in Pediatrics.
2024;5(4):146-156. doi:10.59213/TP.2024.183
- Dhansay, Sharma AN, Yadav S. Composite Index
of Anthropometric Failure among below. Antrocom
Online Journal of Anthropology.
2022;18(1):221-232. Available at https://antrocom.net/wp/wp-content/uploads/2024/05/dhansay-anthropometric-failure-children-korba-block-chhattisgarh.pdf
|


