|
Introduction
Road-traffic
injuries are responsible for approximately 1.19
million deaths globally each year and a
substantially larger non-fatal disability burden,
with low- and middle-income countries bearing the
disproportionate share.(1,2) India alone
contributes nearly one-tenth of all global
road-traffic deaths and has the largest absolute
road-injury burden of any single country.(1,3,4)
The United Nations Decade of Action for Road
Safety 2021-2030 has set a target of halving
global road-traffic deaths and serious injuries by
2030, with explicit prioritisation of
vulnerable-road-user (VRU) protection.(5)
Within this context,
vulnerable road users - pedestrians, cyclists and
motorcyclists - constitute a heterogeneous and
rapidly growing risk pool whose protection
requires distinct policy levers. Pedestrian
protection depends on infrastructure design, speed
management and crossing engineering; cyclist
protection depends on segregated infrastructure,
route planning and visibility; motorcyclist
protection depends on helmet compliance,
licensing, anti-lock braking adoption and
post-crash care.(6-9) These levers are not
interchangeable, and the relative weight of
investment between them should be guided by the
modal composition of road-injury burden in each
setting.(9,10)
The Indian evidence
base, however, has historically been dominated by
aggregate road-death counts from administrative
systems, particularly the Ministry of Road
Transport and Highways and the National Crime
Records Bureau.(11,12) Aggregate counts conceal
mode-specific composition and capture only the
fatal end of the injury distribution; they cannot
inform the relative emphasis between motorcyclist,
pedestrian and cyclist policy. Existing
sub-national disability-adjusted life-year (DALY)
analyses have summarised total road-injury burden
but have not, to our knowledge, characterised
state-level modal composition through the COVID-19
pandemic recovery period of 2020 to 2023.(3,4,13)
The COVID-19
pandemic period offers a natural quasi-experiment
for understanding state-level road-injury
dynamics. National lockdowns in 2020 sharply
reduced motorised mobility and overall road-injury
exposure, with partial relaxation through 2021 and
progressive normalisation by 2023.(14,15) Whether
the post-lockdown trajectory was uniform across
states and modes, whether high-burden states
rebounded disproportionately, and whether the
pandemic equalised or preserved state burden
positions are open questions of direct relevance
to vulnerable-road-user policy.(16,17)
We therefore
conducted an ecological cross-sectional analysis
with three pre-specified objectives. First, to
quantify mode-specific road-injury DALY burden
across all 32 Indian state and union-territory
analytical units for 2020 to 2023, with
cross-validation against administrative road-death
rankings where available. Second, to characterise
the pandemic-to-recovery trajectory by state and
mode using a state-level rebound regression model
that tests whether high-baseline-burden states
changed disproportionately. Third, to quantify
mode-specific inter-state inequality through Gini
coefficients and Lorenz curves, in order to
identify the modal stratum and the state cluster
where VRU policy intensification is most needed.
Material And Methods
Study design
and data sources
We conducted an
ecological cross-sectional analysis using publicly
available aggregated secondary data. The primary
analytical source was the Global Burden of Disease
(GBD) 2021 subnational extract for Indian states
and state-equivalent units, accessed through the
Global Burden of Disease Results Tool of the
Institute for Health Metrics and
Evaluation.(1,3,4,18) Cross-validation was
conducted against state road-death counts from the
Ministry of Road Transport and Highways report
Road Accidents in India 2023 for the ten
high-burden states for which calendar-year 2023
counts are reported.(11) The National Crime
Records Bureau report Accidental Deaths and
Suicides in India 2023 was used to provide context
on accidental death rates.(12) Reporting follows
the STROBE statement for cross-sectional
observational studies.(19)
Time frame
and analytical units
The analytical panel
comprised 32 state and state-equivalent units in
India for the four calendar years 2020 to 2023.
Geographic units were harmonised across GBD,
Ministry of Road Transport and Highways and
National Crime Records Bureau through a fixed
crosswalk. Jammu and Kashmir and Ladakh remained
combined as a single analytical unit, consistent
with the GBD 2021 subnational scheme; smaller
territories that are not separately enumerated in
all sources were combined into an "Other Union
Territories" unit. This choice prioritised
internal consistency across data sources over
exact reproduction of every current administrative
boundary.
Mode-specific
outcomes
We extracted
age-standardised DALY rates and age-standardised
mortality rates per 100,000 population for both
sexes combined and all ages, for the following GBD
road-injury sub-categories: pedestrian road
injuries, cyclist road injuries, motorcyclist road
injuries, motor-vehicle road injuries, other road
injuries, and the aggregate "road injuries"
category. Vulnerable-road-user (VRU) burden was
defined a priori as the sum of pedestrian, cyclist
and motorcyclist DALY rates, consistent with World
Health Organization terminology.(1,5)
Pandemic-to-recovery
rebound analysis
For each mode, we
computed the per-state change in age-standardised
DALY rate between 2020 (lockdown year) and 2023
(recovery year) as the absolute difference and as
the percent change. To examine whether
high-baseline-burden states changed
disproportionately, we fitted
ordinary-least-squares regression models within
each mode of the form change_in_rate_2023_2020 =
beta_0 + beta_1 * baseline_rate_2020 + epsilon,
with normal-approximation 95% confidence
intervals. A negative slope (beta_1 < 0)
would indicate convergence (high-baseline states
rebounded less or fell more); a positive slope
would indicate divergence; a slope statistically
indistinguishable from zero would indicate that
state burden positions persisted through the
pandemic.
Inter-state
inequality
Inter-state
inequality in age-standardised DALY rates was
quantified for each year and mode using the
coefficient of variation, the Gini coefficient
(computed across the 32 state-level rates), the
top-to-bottom ratio (maximum divided by minimum),
and the share of total mode-specific DALY burden
held by the top 20% of states. We additionally
generated Lorenz curves of cumulative state-share
against cumulative burden-share for the major
modes in 2023.(20)
Cross-validation
against administrative data
For the ten
high-burden states for which Ministry of Road
Transport and Highways calendar-year 2023
road-death counts are reported, we computed the
Spearman rank correlation between GBD road-injury
DALY rank and administrative road-death rank, and
the Pearson correlation between absolute counts.
Discordance was interpreted qualitatively given
differences in year of measurement, definition
(police-recorded fatalities vs modelled DALYs) and
reporting construct.(21)
Quality
control and software
All numeric results
were independently recomputed from the analytical
panel prior to manuscript preparation; all rounded
values reported below were derived from the
recomputed analytical files. Analyses were
performed in Python with the pandas, numpy and
scipy libraries; figures were produced with
matplotlib. No individual-level data were used;
institutional review board approval and informed
consent were not applicable.
Results
National burden by mode and year
Across the 32-unit
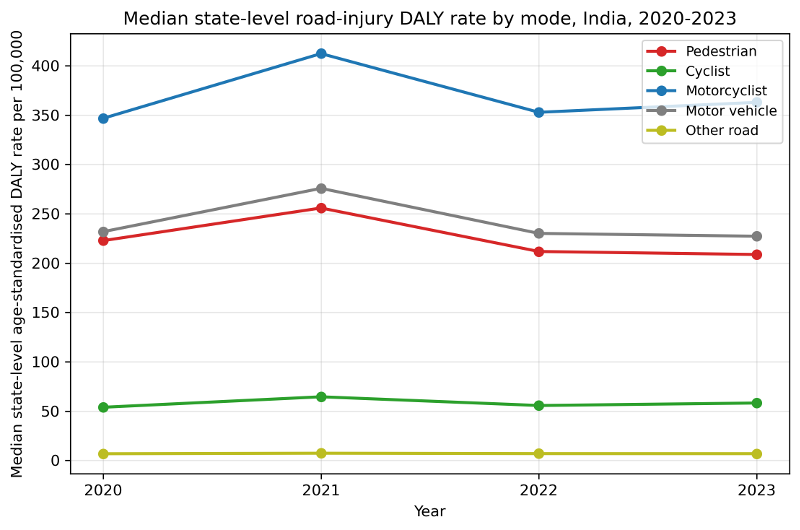
panel, motorcyclist injuries accounted for the
largest median state-level age-standardised DALY
rate in 2023 (362.9 per 100,000), followed by
motor-vehicle injuries (227.3), pedestrian
injuries (208.7), cyclist injuries (58.3) and
other road injuries (6.9) (Table 1, Figure 1). The
aggregate road-injury median DALY rate in 2023 was
868.7 per 100,000 (state-level range 474 to 1752).
Vulnerable-road-user mechanisms together
contributed a median 74.7% of state-level
road-injury DALYs in 2023 (versus 74.2% in 2020),
with motorcyclists alone contributing 42.2%,
pedestrians 23.5% and cyclists 7.2% at the median
state level.
|
Table 1: Median state-level
age-standardised road-injury DALY rate
by mode, India, 2020-2023.
|
|
Mode
|
2020
|
2021
|
2022
|
2023
|
|
All road
|
874.9
|
977.3
|
848.7
|
868.7
|
|
Pedestrian
|
222.8
|
255.9
|
211.8
|
208.7
|
|
Cyclist
|
53.9
|
64.5
|
55.7
|
58.3
|
|
Motorcyclist
|
346.7
|
412.3
|
352.8
|
362.9
|
|
Motor vehicle
|
231.9
|
275.8
|
230.1
|
227.3
|
|
Other road
|
6.8
|
7.4
|
7.0
|
6.9
|
|
Values are state-level medians of
age-standardised DALY rates per 100,000
population across the 32 analytical
state and state-equivalent units. DALY:
disability-adjusted life year.
|
|
| Figure
1: Median state-level age-standardised
road-injury DALY rate by mode, India,
2020-2023. Lines show the state-level
median across the 32 analytical state and
state-equivalent units. Motorcyclist
injuries dominate the modal composition
throughout. DALY: disability-adjusted life
year. |
Pandemic-to-recovery
rebound by mode
Between 2020 and
2023, modal trajectories diverged (Table 2, Figure
2). Cyclist DALY rates rose in 30 of 32 states
(median +5.4%), motorcyclist rates rose in 25 of
32 states (median +5.4%), and other road injuries
rose in 25 of 32 states (median +2.8%). In
contrast, pedestrian rates declined in 26 of 32
states (median -2.3%) and motor-vehicle rates
declined in 21 of 32 states (median -1.1%). The
aggregate road-injury rate rose marginally (median
+1.9%) and increased in 21 of 32 states.
|
Table 2: Pandemic-to-recovery
rebound by mode: state-level percent
change in DALY rate, 2020-2023.
|
|
Mode
|
Median % change
|
IQR
|
States with increase
|
States with decrease
|
Rebound regression slope (95% CI;
p)
|
|
All road
|
+1.9
|
-2.7 to +3.0
|
21/32
|
11/32
|
-0.0185 (-0.0925 to +0.0555; p = 0.624)
|
|
Pedestrian
|
-2.3
|
-7.1 to -1.1
|
6/32
|
26/32
|
-0.0176 (-0.0807 to +0.0455; p = 0.584)
|
|
Cyclist
|
+5.4
|
+2.9 to +9.1
|
30/32
|
2/32
|
+0.0252 (-0.0139 to +0.0642; p = 0.207)
|
|
Motorcyclist
|
+5.4
|
+1.2 to +7.7
|
25/32
|
7/32
|
+0.0031 (-0.0502 to +0.0564; p = 0.909)
|
|
Motor vehicle
|
-1.1
|
-4.1 to +1.5
|
11/32
|
21/32
|
+0.0396 (-0.0523 to +0.1315; p = 0.398)
|
|
Other road
|
+2.8
|
+1.0 to +4.8
|
25/32
|
7/32
|
-0.0218 (-0.0705 to +0.0269; p = 0.381)
|
|
Percent change is the state-level
median of (rate_2023 - rate_2020) /
rate_2020 expressed as a percentage. The
rebound regression fits change in DALY
rate (2023 - 2020) on baseline (2020)
DALY rate across the 32 state-level
units within each mode; a slope of zero
indicates that state burden positions
persisted through the pandemic. IQR:
25th to 75th percentile of state-level
percent change.
|
|
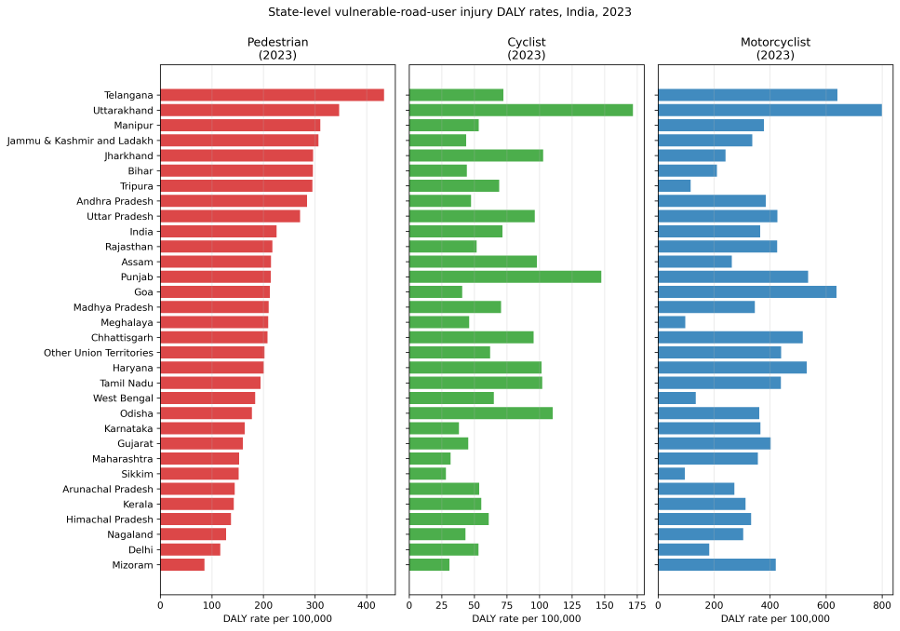
| Figure
2: State-level vulnerable-road-user injury
DALY rates by mode, India, 2023. Each
panel shows the 32 state-level
age-standardised DALY rates for one
vulnerable-road-user mode, ranked from
lowest to highest. The right-hand panel
(motorcyclist) shows the largest absolute
spread. |
State-level rebound
regression of the 2023 minus 2020 change on the
2020 baseline rate did not yield statistically
significant slopes for any vulnerable-road-user
mode: pedestrian beta = -0.0176 (95% CI -0.0807 to
0.0455; p = 0.584); cyclist beta = 0.0252 (95% CI
-0.0139 to 0.0642; p = 0.207); motorcyclist beta =
0.0031 (95% CI -0.0502 to 0.0564; p = 0.909).
State burden positions therefore persisted through
the pandemic with no statistically detectable
convergence or divergence.
Inter-state
inequality by mode
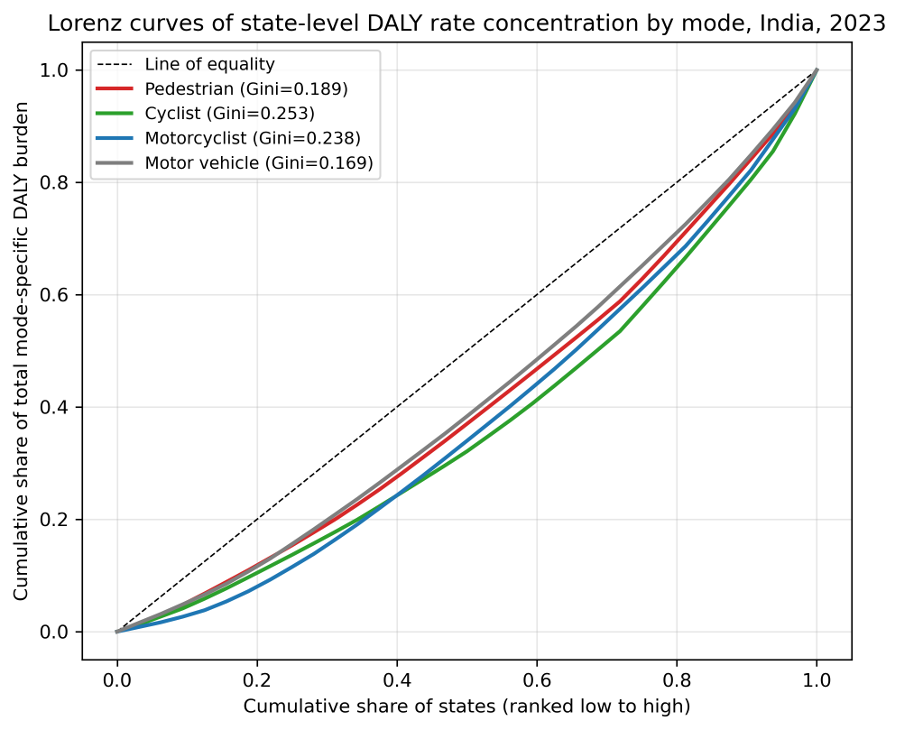
Inequality across
states was greatest for motorcyclist injuries
(Gini 0.238; coefficient of variation 8.3-fold
range; top 20% of states held 31.4% of total
motorcyclist burden), followed by cyclist injuries
(Gini 0.253; range 6.1-fold) and pedestrian
injuries (Gini 0.189; range 5.0-fold) (Table 3,
Figure 3,4). Motor-vehicle injury rates were the
most evenly distributed (Gini 0.169; range
3.7-fold). Lorenz curves confirmed that
motorcyclist burden was disproportionately
concentrated in a small group of high-burden
states, while motor-vehicle burden tracked closer
to the line of equality.
|
Table 3: Inter-state inequality
in age-standardised DALY rate by mode,
India, 2023.
|
|
Mode
|
Median rate
|
Min
|
Max
|
Gini
|
Top-bottom ratio
|
|
All road
|
868.7
|
474.3
|
1752.2
|
0.151
|
3.7
|
|
Pedestrian
|
208.7
|
85.8
|
433.8
|
0.189
|
5.1
|
|
Cyclist
|
58.3
|
28.3
|
171.8
|
0.253
|
6.1
|
|
Motorcyclist
|
362.9
|
96.0
|
799.3
|
0.238
|
8.3
|
|
Motor vehicle
|
227.3
|
115.5
|
424.0
|
0.169
|
3.7
|
|
Other road
|
6.9
|
4.6
|
13.6
|
0.157
|
3.0
|
|
DALY rates are per 100,000
population. Gini coefficient computed
across 32 state-level age-standardised
DALY rates. Top-bottom ratio is maximum
divided by minimum state-level rate.
|
Cross-validation
against Ministry of Road Transport and Highways
data
For the ten
high-burden states with comparable 2023
administrative road-death counts, the Spearman
rank correlation between the GBD road-injury DALY
rank and the Ministry of Road Transport and
Highways road-death rank was 0.65 (p = 0.043); the
Pearson correlation between absolute counts was
0.78 (p = 0.008) (Table 4). Concordance was strong
at the extremes (Uttar Pradesh ranked first in
both systems) but moderate in the middle of the
distribution (Bihar, second by GBD modelled DALYs,
ranked seventh in administrative road-death
counts), consistent with under-registration of
rural road-injury fatalities and survivors with
severe disability in administrative systems and
supporting the use of GBD modelled estimates as
the analytical primary.
|
Table 4: Cross-validation: GBD
modelled road-injury DALY rank vs
Ministry of Road Transport and Highways
administrative road-death rank, ten
high-burden Indian states, 2023.
|
|
State
|
GBD road DALYs
|
MoRTH road deaths
|
GBD rank
|
MoRTH rank
|
|
Uttar Pradesh
|
5,203,642
|
23,652
|
1
|
1
|
|
Tamil Nadu
|
1,785,278
|
18,347
|
4
|
2
|
|
Maharashtra
|
1,741,253
|
15,366
|
5
|
3
|
|
Madhya Pradesh
|
1,911,651
|
13,798
|
3
|
4
|
|
Karnataka
|
1,321,007
|
12,321
|
8
|
5
|
|
Rajasthan
|
1,629,925
|
11,762
|
7
|
6
|
|
Bihar
|
1,962,642
|
8,873
|
2
|
7
|
|
Andhra Pradesh
|
1,234,560
|
8,137
|
10
|
8
|
|
Gujarat
|
1,659,405
|
7,854
|
6
|
9
|
|
Telangana
|
1,295,966
|
7,660
|
9
|
10
|
|
Spearman rank correlation rho = 0.65
(p = 0.043); Pearson r between absolute
counts = 0.78 (p = 0.008). GBD: Global
Burden of Disease 2021 modelled
road-injury DALYs (2023). MoRTH:
Ministry of Road Transport and Highways
calendar-year 2023 administrative
road-death counts.
|
|
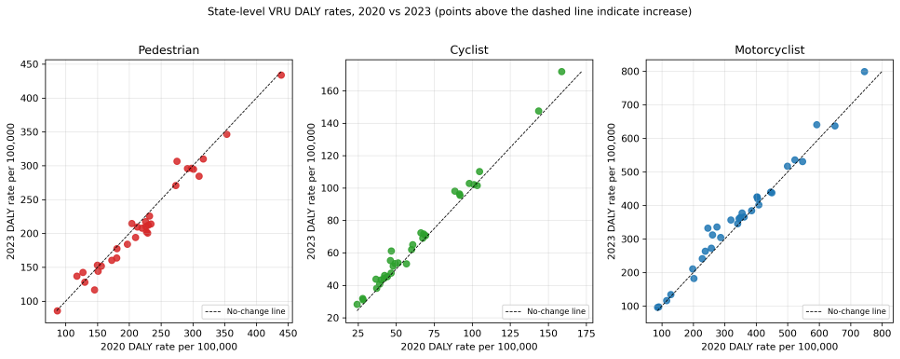
| Figure
3: State-level VRU DALY rates, 2020 vs
2023, by mode. Each point is one state.
Points above the dashed no-change line
indicate increased burden in 2023. Cyclist
DALY rates rose in 30 of 32 states;
motorcyclist rates rose in 25 of 32
states; pedestrian rates declined in most
states. |
|
| Figure 4: Lorenz curves of
state-level DALY rate concentration by
mode, India, 2023. Curves further from the
line of equality indicate greater
concentration of total mode-specific DALY
burden in a small group of states.
Motorcyclist injury shows the greatest
concentration; motor-vehicle injury is
distributed closest to equality. |
Discussion
This is, to our
knowledge, the first sub-national mode-stratified
analysis of road-injury DALY burden across all
Indian states and union territories through the
COVID-19 pandemic recovery period. Three findings
emerge.
First,
vulnerable-road-user mechanisms dominate the
road-injury burden in India and have not changed
in modal composition through the pandemic. The
median state-level VRU share of 74.7% in 2023 is
closely consistent with the World Health
Organization Global Status Report on Road Safety,
which estimates that vulnerable road users account
for more than half of road-traffic deaths globally
and a higher fraction in low- and middle-income
countries.(1,5,9) The dominance of motorcyclist
injury (median 42.2% of state-level burden)
reflects the rapid two-wheeler motorisation of
India over the past two decades and is consistent
with prior Indian and South Asian estimates that
placed motorcyclist deaths at one-third or more of
all road fatalities.(4,9,17,22) These findings
support a fundamental reframing of national
road-safety investment around
motorcyclist-specific interventions: helmet
enforcement and quality, anti-lock braking system
mandates for new motorcycles, lane discipline and
dedicated lane infrastructure where feasible,
structured rider licensing, and post-crash care
directed at the high-energy crash physics
characteristic of two-wheeler injury.(6,7,9,23,24)
Second, the cyclist
trajectory is anomalous and policy-relevant.
Cyclist DALY rates rose in 30 of 32 states between
2020 and 2023 (median +5.4%), opposite in
direction to pedestrian and motor-vehicle burden.
This pattern is consistent with global
observations that cycling exposure rose during the
pandemic and did not retreat fully to pre-pandemic
levels in the recovery phase, while road
infrastructure remained calibrated to motorised
traffic.(25,26) For India this implies that state
surveillance must capture cyclist injury, that
segregated cycling infrastructure should be funded
as part of the broader push for non-motorised
transport in cities, and that mixed-traffic
exposure assessments should be incorporated into
urban transport planning.(26,27)
Third, motorcyclist
injury rates are the most unequally distributed
across Indian states (Gini 0.238; 8.3-fold range),
and state burden positions persisted through the
pandemic. The combination of high modal
contribution and high inter-state inequality
identifies motorcyclist injury as the modal
stratum where state-stratified policy can be
expected to deliver the largest national gain. The
non-significant rebound regression slopes indicate
that the pandemic did not equalise state burden,
providing direct evidence against a passive
"natural recovery" hypothesis. State-level VRU
policy intensification, rather than uniform
national targets, is therefore required to meet
the United Nations Decade of Action 2021-2030
ambition of halving road-traffic deaths and
serious injuries by 2030.(5)
Cross-validation
against the Ministry of Road Transport and
Highways data showed moderate-to-strong
concordance with the GBD modal ranking (Spearman
rho = 0.65, p = 0.043; Pearson r = 0.78).
Discordance in the middle of the distribution,
particularly for Bihar, is consistent with prior
Indian and global findings that police-recorded
road-death systems systematically underweight
rural fatalities and non-fatal injury
sequelae.(21,28)
The study has
limitations. First, it is ecological and cannot
support individual-level causal inference. Second,
GBD 2021 estimates are modelled and depend on
input data availability, cause attribution and
disability weights; the modal composition reported
here should be interpreted accordingly. Third, the
2020 baseline corresponds to a national lockdown
year and therefore reflects sharply reduced
motorised exposure rather than typical
pre-pandemic burden; the rebound regression should
be read in that light. Fourth, the
cross-validation against Ministry of Road
Transport and Highways data is restricted to ten
states for which calendar-year 2023 counts are
publicly reported. Fifth, the analytical units
include a combined Jammu and Kashmir and Ladakh
entity and an aggregated "Other Union Territories"
unit, neither of which corresponds exactly to
current administrative boundaries.
Strengths include
the use of fully reproducible publicly available
data; the first sub-national mode-stratified GBD
analysis through the pandemic recovery period for
India; the explicit linkage of state-level burden
patterns to actionable VRU policy levers; the
inclusion of state-level rebound regression and
Lorenz-based inequality analysis; and the
cross-validation against the principal Indian
administrative road-death source.
Implications for
policy and practice are direct. State-stratified
VRU policy should prioritise (i) motorcyclist
protection in the high-burden mortality-prominent
cluster identified here, with helmet enforcement,
anti-lock braking system adoption, and
motorcyclist-aware emergency-response capacity;
(ii) cyclist surveillance and infrastructure
expansion across all states given the broad-based
rise in cyclist injury; and (iii)
pedestrian-environment design in the urban states
where pedestrian DALY burden remains
disproportionately high. Routine state-level
road-safety reports should publish modal
composition alongside aggregate counts to enable
accountability against the Decade of Action
targets.(5,9,29,30)
Conclusion
Vulnerable-road-user
injury, dominated by motorcyclist burden, accounts
for approximately three-quarters of state-level
road-injury DALYs in India. Cyclist injury rose in
nearly all states between 2020 and 2023, opposite
in direction to motor-vehicle and pedestrian
burden. Inter-state inequality is greatest for
motorcyclist injury, and state burden positions
persisted through the pandemic. State-stratified
VRU policy targeting motorcyclist protection in
high-burden states, cyclist infrastructure
nationally, and pedestrian-environment redesign in
urban states is required to meet the Decade of
Action 2021-2030 targets.
Acknowledgements
The author
acknowledges the Institute for Health Metrics and
Evaluation, the Ministry of Road Transport and
Highways, and the National Crime Records Bureau
for making the underlying datasets publicly
available.
Data availability: All source
datasets are publicly available from the Global
Burden of Disease Results Tool (Institute for
Health Metrics and Evaluation), the Ministry of
Road Transport and Highways (Road Accidents in
India 2023) and the National Crime Records Bureau
(Accidental Deaths and Suicides in India 2023).
Processed analytical files and analysis code that
support the findings of this study are available
from the corresponding author on reasonable
request.
Prior publication: This work
has not been published previously and is not under
consideration for publication elsewhere, in whole
or in part.
Use of artificial intelligence:
Generative artificial-intelligence tools were used
solely for language polishing and formatting
checks. The author verified all data,
calculations, interpretations and references and
bears full responsibility for the scientific
content of the manuscript.
References
- World Health Organization. Global status
report on road safety 2023. Geneva: World Health
Organization; 2023. Available from: https://www.who.int/publications/i/item/9789240086517.
Accessed May 5, 2026.
- GBD 2019 Diseases and Injuries Collaborators.
Global burden of 369 diseases and injuries in
204 countries and territories, 1990-2019: a
systematic analysis for the Global Burden of
Disease Study 2019. Lancet
2020;396:1204-22. doi:
10.1016/S0140-6736(20)30925-9.
- India State-Level Disease Burden Initiative
Road Injury Collaborators. Mortality due to road
injuries in the states of India: the Global
Burden of Disease Study 1990-2017. Lancet
Public Health 2020;5:e86-e98. doi:
10.1016/S2468-2667(19)30246-4.
- GBD 2021 Diseases and Injuries Collaborators.
Global incidence, prevalence, years lived with
disability, disability-adjusted life-years, and
healthy life expectancy for 371 diseases and
injuries in 204 countries and territories and
811 subnational locations, 1990-2021: a
systematic analysis for the Global Burden of
Disease Study 2021. Lancet
2024;403:2133-61. doi:
10.1016/S0140-6736(24)00757-8.
- United Nations General Assembly. Improving
global road safety: Resolution A/RES/74/299. New
York: United Nations; 2020. Available from: https://digitallibrary.un.org/record/3879711.
Accessed May 5, 2026.
- Liu BC, Ivers R, Norton R, et al. Helmets for
preventing injury in motorcycle riders. Cochrane
Database Syst Rev 2008;(1):CD004333. doi:
10.1002/14651858.CD004333.pub3.
- Teoh ER, Campbell M. Role of motorcycle type
in fatal motorcycle crashes. J Safety Res 2010;41:507-12.
doi: 10.1016/j.jsr.2010.10.005.
- Retting RA, Ferguson SA, McCartt AT. A review
of evidence-based traffic engineering measures
designed to reduce pedestrian-motor vehicle
crashes. Am J Public Health
2003;93:1456-63. doi:10.2105/AJPH.93.9.1456
- Tiwari G, Goel R, Bhalla K. Road safety in
India: status report 2023. New Delhi:
Transportation Research and Injury Prevention
Centre, Indian Institute of Technology Delhi;
2023. Available from: https://tripc.iitd.ac.in/assets/publication/RSI_2023_web.pdf.
Accessed May 5, 2026.
- Peden M, Scurfield R, Sleet D, et al, editors.
World report on road traffic injury prevention.
Geneva: World Health Organization; 2004.
Available from: https://www.who.int/publications/i/item/world-report-on-road-traffic-injury-prevention.
Accessed May 5, 2026.
- Ministry of Road Transport and Highways,
Government of India. Road accidents in India
2023. New Delhi: Government of India; 2024.
Available from: https://morth.nic.in/en/road-accidents-india-2023.
Accessed May 5, 2026.
- National Crime Records Bureau, Ministry of
Home Affairs, Government of India. Accidental
deaths and suicides in India 2023. New Delhi:
Government of India; 2024. Available from: https://www.data.gov.in/catalog/accidental-deaths-suicides-india-adsi-2023.
Accessed May 5, 2026.
- Hsiao M, Malhotra A, Thakur JS, et al. Road
traffic injury mortality and its mechanisms in
India: nationally representative mortality
survey of 1.1 million homes. BMJ Open
2013;3:e002621. doi:
10.1136/bmjopen-2013-002621.
- Calderon-Anyosa RJC, Bilal U, Kaufman JS.
Variation in non-external and external causes of
death in Peru in relation to the COVID-19
lockdown. Yale J Biol Med 2021;94:23-40.
- Stiles J, Kar A, Lee J, et al. Lower volumes,
higher speeds: changes to crash type, timing,
and severity on urban roads from COVID-19
stay-at-home policies. Transp Res Rec
2023;2677:15-27. doi: 10.1177/03611981211044454.
- Vingilis E, Beirness DJ, Boase P, et al.
Coronavirus disease 2019: what could be the
effects on road safety? Accid Anal Prev 2020;144:105687.
doi: 10.1016/j.aap.2020.105687.
- Bhalla K, Sriram V, Arora R, et al. The care
and transport of trauma victims by layperson
emergency medical systems: a qualitative study
in Delhi, India. BMJ Glob Health
2019;4:e001963. doi: 10.1136/bmjgh-2019-001963.
- Institute for Health Metrics and Evaluation.
Global Burden of Disease Results Tool. Seattle,
WA: IHME; 2024. Available from: https://vizhub.healthdata.org/gbd-results.
Accessed May 5, 2026.
- von Elm E, Altman DG, Egger M, et al. The
Strengthening the Reporting of Observational
Studies in Epidemiology (STROBE) statement:
guidelines for reporting observational studies.
Lancet 2007;370:1453-7. doi:
10.1016/S0140-6736(07)61602-X.
- Mackenbach JP, Kunst AE. Measuring the
magnitude of socio-economic inequalities in
health: an overview of available measures
illustrated with two examples from Europe. Soc
Sci Med 1997;44:757-71. doi:
10.1016/S0277-9536(96)00073-1.
- Bhalla K, Naghavi M, Shahraz S, et al.
Building national estimates of the burden of
road traffic injuries in developing countries
from all available data sources: Iran. Inj
Prev 2009;15:150-6. doi:
10.1136/ip.2008.020826.
- Gururaj G. Road traffic deaths, injuries and
disabilities in India: current scenario. Natl
Med J India 2008;21:14-20.
- Roy N, Murlidhar V, Chowdhury R, et al. Where
there are no emergency medical
services-prehospital care for the injured in
Mumbai, India. Prehosp Disaster Med
2010;25:145-51. doi: 10.1017/S1049023X00007883.
- Naci H, Chisholm D, Baker TD. Distribution of
road traffic deaths by road user group: a global
comparison. Inj Prev 2009;15:55-9. doi:
10.1136/ip.2008.018721.
- Buehler R, Pucher J. COVID-19 impacts on
cycling, 2019-2020. Transp Rev 2021;41:393-400.
doi: 10.1080/01441647.2021.1914900.
- Aldred R, Goodman A. Predictors of the
frequency and subjective experience of cycling
near misses: findings from the first two waves
of the Near Miss Project. Accid Anal Prev
2018;110:161-70. doi: 10.1016/j.aap.2017.09.015.
- Tiwari G. Progress in pedestrian safety
research. Int J Inj Contr Saf Promot
2020;27:35-43. doi:
10.1080/17457300.2020.1720255.
- Hyder AA, Sugerman DE, Puvanachandra P, et al.
Global childhood unintentional injury
surveillance in four cities in developing
countries: a pilot study. Bull World Health
Organ 2009;87:345-52. doi:
10.2471/BLT.08.055798.
- Mock C, Kobusingye O, Joshipura M, et al.
Strengthening trauma and critical care globally.
Curr Opin Crit Care 2005;11:568-75. doi:
10.1097/01.ccx.0000186373.49320.65.
- Reynolds TA, Stewart B, Drewett I, et al. The
impact of trauma care systems in low- and
middle-income countries. Annu Rev Public
Health 2017;38:507-32. doi:
10.1146/annurev-publhealth-032315-021412.
|


