|
Introduction
Childhood
undernutrition remains a persistent public health
challenge in India. Despite sustained efforts to
reduce its prevalence. According to NFHS-5, nearly
35.5% of Indian children under five are stunted,
32.1% are underweight, and 19.3% are wasted [1].
Malnutrition are known to have long-term effects
on cognitive development, immunity, school
performance, and economic productivity [2].
According to WHO (2008), “Dietary diversity,
defined as the number of different food groups
consumed over a reference period”, has emerged as
a key indicator of diet quality and micronutrient
adequacy in young children [3].A child meets the
Minimum Dietary Diversity (MDD) requirement when
he or she consumes meals from at least five of the
eight food groups within the last 24 hours. A lack
of diversity is frequently an indicator for poor
household food security, poverty, and low
nutritional understanding [4].
Several
studies have demonstrated a strong association
between dietary diversity and improved nutritional
outcomes, including lower odds of stunting and
underweight [5, 6].
Despite
numerous national-level study on childhood
undernutrition and dietary diversity in India,
limited studies have explored how these relations
vary within high-burden states like Uttar Pradesh
[1], especially among different socioeconomic
strata. Most existing studies address
undernutrition as a uniform condition, failing to
distinguish between its various forms like
stunting, wasting, being underweight, and having
multiple deficiencies at the same time and how
dietary diversity affects each individually. Also,
the interaction among wealth index and minimum
dietary diversity as a moderator of nutritional
outcomes is understudied.
Therefore, to develop targeted interventions to
better influence effective nutrition policies,
there is a critical need for state-specific,
detailed study that investigates these complicated
associations.
Objective: To estimate the
association between dietary diversity and various
forms of undernutrition among children aged 6–59
months in Uttar Pradesh, and to evaluate the
moderating effect of household socioeconomic
status on this relationship.
Materials and Methods
Study Design and Data Source
“This study employs
a cross-sectional analytical design using data
from the Fifth National Family Health Survey
(NFHS-5, 2019–21), a large-scale, nationally
representative household survey conducted across
India. The NFHS-5 follows a multistage, stratified
cluster sampling technique. The current analysis
focuses exclusively on children aged 6–59 months
in Uttar Pradesh, using the child recode (KR) and
household datasets provided by the Demographic and
Health Surveys (DHS) program.
|
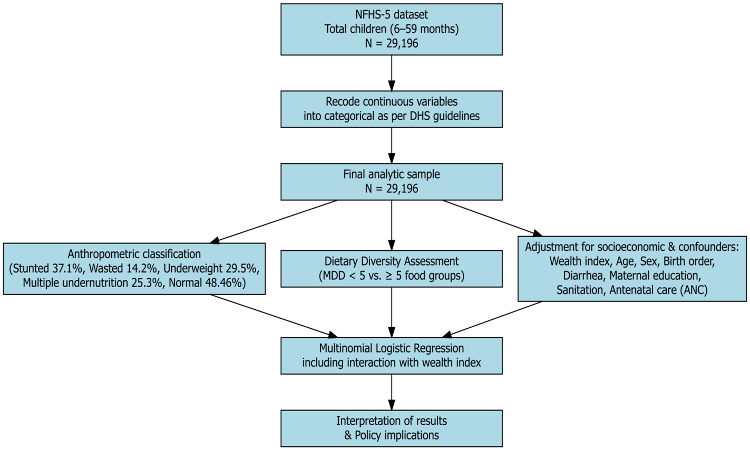
| Figure
1: Flow Diagram of Study Methodology
|
Study
Population
Children aged 6–59
months with valid anthropometric data and complete
information on dietary diversity and key
covariates were included. Cases with biologically
implausible Z-scores (|Z| > 6 SD)/ missing
values on outcome or explanatory variables were
excluded. The final analytical sample comprises
29,196 children. The Workflow of this study was
mentioned in Figure 1.
Dependent/Outcome
Variable: Nutritional Status
The dependent
variable was nutritional status, categorized into
six mutually exclusive groups derived from
anthropometric Z-scores based on WHO (2006) growth
standards: Normal (Reference category), Stunted
only: Height-for-age Z-score (HAZ) < −2 SD,
Underweight only: Weight-for-age Z-score (WAZ)
< −2 SD, Wasted only: Weight-for-height Z-score
(WHZ) < −2 SD, Multiple undernutrition: Any
combination of two or more of the above,
Overweight: WHZ > +2 SD. These categories were
computed using the following definitions:
Zi=(Xi−μ)/σ
Where Zi is the
z-score for child I, Xi is the observed
anthropometric measure (e.g., height, weight), μ
and σ are the median and standard deviation of the
reference population.
Key
Explanatory Variable:
i) Minimum Dietary
Diversity (MDD) was assessed based on the WHO IYCF
guidelines [7]. The mother reported the types of
foods consumed by the child in the last 24 hours.
Eight food groups were considered: i) Breast milk
ii) Grains, roots, and tubers iii) Legumes and
nuts iv) Dairy products v) Flesh foods vi) Eggs
vii) Vitamin A-rich fruits and vegetables viii)
Other fruits and vegetables
Children consuming
≥5 out of 8 food groups were considered to meet
the MDD threshold:
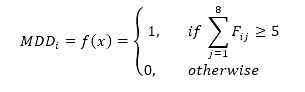
Where is Fij
a binary indicator of consumption of food group j
by child i.
ii) Confounding
factors: The model adjusted for key
covariates known to influence child nutrition,
grouped into: Child-level: age (categorized), Sex
(Male/Female), birth order (1/2/>2), diarrhea
(Yes/No), Maternal education level, Household
wealth index, type of sanitation (Improved Toilet
Facility), Antenatal care (ANC).”
Data
Analysis: Frequencies, percentages,
and cross-tabulations were used for descriptive
statistics. To assess association between
predictors and nutritional status categories
Chi-square tests were utilized.
Multinomial
Logistic Regression: To estimate adjusted
associations, Multinomial Logistic Regression
(MLR) was applied with "Normal" nutrition status
as the reference outcome. The general form of the
MLR model is:
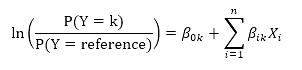
Where P(Y=k) is the
probability of child being in nutrition category k,
β0k is the intercept for category k,
Xi are predictor variables and βik
are the coefficients (log-odds) for predictors in
category k. The Relative Risk Ratio
(RRR) for each predictor was computed by
exponentiation of the β-coefficients i.e. RRR=exp(β).
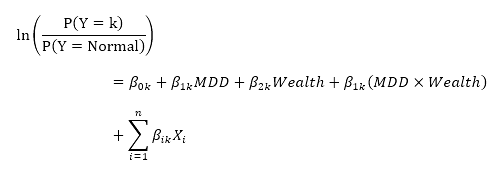
To explore effect modification, an
interaction term between Wealth Index and MDD was
introduced:
Model significance
was assessed at p < 0.05. Analyses were
performed using R studio software.
Results
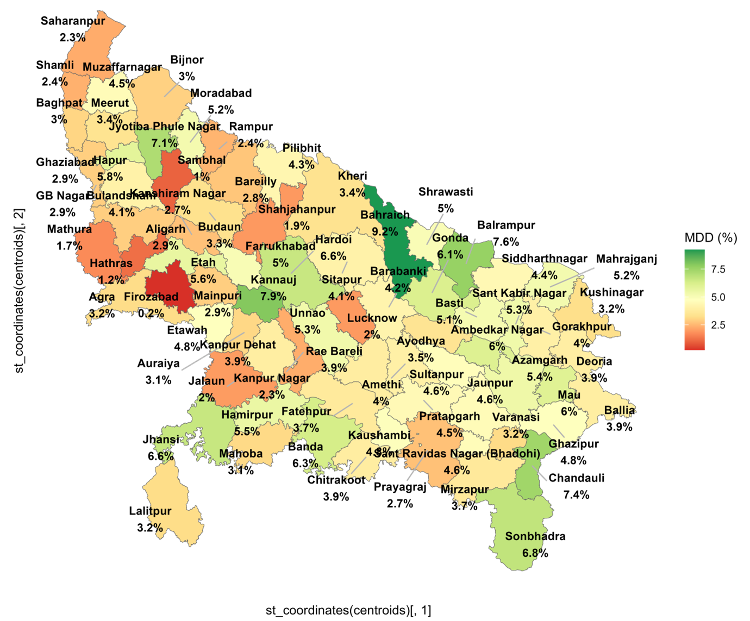
The
average MDD prevalence in Uttar Pradesh is 4.2%,
with considerable district-to-district variations.
The regions with the lowest MDD prevalence
reported in Firozabad (0.2%), Sambhal (0.99%), and
Hathras (1.2%) while districts like Sonbhadra
(6.8%), Balrampur (7.6%), and Bahraich (9.2%) have
greater MDD prevalence (Figure 2).
|
| Figure
2: Spatial distribution of MDD among
children aged 6–59 months by district in
Uttar Pradesh, India |
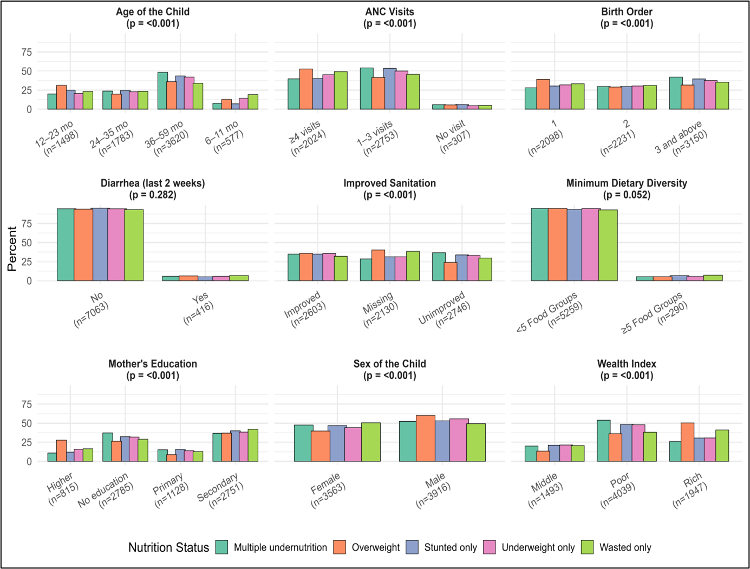
Figure 3 shows the
distribution of child nutritional status varied
significantly across demographic, socioeconomic,
and health-related characteristics in Uttar
Pradesh. Out of 29,196 children, stunting was most
prevalent among children aged 36–59 months
(43.6%), whereas wasting and underweight were more
common in younger age groups, particularly 6–23
months (p < 0.001). Boys had a consistently
higher prevalence of stunting (53.1%), underweight
(55.8%), and overweight (60.2%) than girls (p <
0.001).
Household wealth was
strongly associated with nutritional outcomes.
Children from poorer households showed the highest
burden of multiple undernutrition (54.0%) and
stunting (48.4%), whereas overweight was
disproportionately higher among children from
wealthier families (50.4%) (p < 0.001).
Maternal education
established a clear protective factor, children of
mothers with secondary or higher education
experienced lower levels of stunting, underweight,
and wasting, and a relatively higher prevalence of
overweight (p < 0.001).
Household sanitation
also found as a significant determinant. Children
in households with unimproved sanitation had
moderate level of stunting (33.8%) and multiple
forms of undernutrition compared to those with
improved facilities (p < 0.001).
ANC visits was
similarly predictive, children whose mothers had
four or more ANC visits had better nutritional
status, including a higher proportion of
overweight (52.8%), while those with no ANC visits
experienced high stunting and undernutrition (p
< 0.001).
An insignificant
association was found between recent diarrheal
episodes and nutritional status (p = 0.282),
though children without diarrhea tended to fare
slightly better.
Birth order was
another critical factor. Children of third or
higher birth order bore the greatest burden of
multiple undernutrition (42.1%) (p < 0.001).
Finally, dietary
diversity was suboptimal across all categories,
with over 90% of undernourished children failing
to meet the minimum dietary diversity threshold
(<5 food groups), though this association
approached but did not reach statistical
significance (p = 0.052).”
Note:
Normal nutritional status (n=14,149), Parenthesis
include column wise percentage. Further cases with
missing values were excluded from analysis
|
| Figure
3: Distribution of Nutritional Status of
Under-Five Children by Background
Characteristics, Uttar Pradesh, NFHS-5
(2019–21) (N=29,196) |
Further, Multinomial
logistic regression was performed to identify
factors associated with different types of
nutritional status, using normal nutrition as the
reference category (Table 1). Age
of the child was strongly associated with
malnutrition outcomes. Children aged 6–11 months
were significantly more likely to be wasted (RRR =
2.07; 95% CI: 1.70–2.52; p < .001), while the
risk of stunting increased progressively between
12–35 months. Male children had higher odds of
stunting (RRR = 1.20; 95% CI: 1.10–1.30; p <
.001) and multiple undernutrition (RRR = 1.11; 95%
CI: 1.04–1.19; p = .003) compared to females.
Household wealth
emerged as a strong predictor. Children from poor
households had significantly higher risk of
stunting (RRR = 1.59; 95% CI: 1.40–1.80; p <
.001), underweight (RRR = 1.57; p = .004), and
multiple undernutrition (RRR = 1.90; p < .001)
compared to those from wealthier households.
Similarly, low maternal education was consistently
associated with higher risk of stunting and
multiple nutritional deficits. For example,
children whose mothers had no formal education had
2.09 times greater risk of multiple undernutrition
(95% CI: 1.84–2.39; p < .001) compared to those
whose mothers had higher education. Interestingly,
Minimum Dietary Diversity (MDD) on its own was not
significantly associated with any nutritional
outcome after adjusting for socioeconomic,
demographic, and maternal variables (p > .05
for all categories).
|
Table 1: Multinomial Logistic
Regression for Predictors of Child
Nutritional Status
(Reference Category: Normal)
|
|
Predictor
|
Stunted Only RRR (95% CI)
|
p-value
|
Underweight Only RRR (95% CI)
|
p-value
|
Wasted Only RRR (95% CI)
|
p-value
|
Multiple Undernutrition RRR (95%
CI)
|
p-value
|
|
Age: 6–11 months
|
0.539 (0.461–0.629)
|
0.000
|
0.763 (0.556–1.048)
|
.095ⁿˢ
|
2.069 (1.698–2.520)
|
0.000
|
0.667 (0.593–0.750)
|
0.000
|
|
Age: 12–23 months
|
1.322 (1.183–1.477)
|
0.000
|
0.806 (0.613–1.061)
|
.124ⁿˢ
|
1.396 (1.151–1.693)
|
0.001
|
0.993 (0.902–1.092)
|
.879ⁿˢ
|
|
Age: 24–35 months
|
1.273 (1.137–1.425)
|
0.000
|
0.996 (0.767–1.294)
|
.977ⁿˢ
|
1.366 (1.122–1.662)
|
0.002
|
1.166 (1.061–1.281)
|
0.001
|
|
Sex: Male
|
1.195 (1.098–1.300)
|
0.000
|
1.086 (0.888–1.328)
|
.420ⁿˢ
|
0.964 (0.842–1.103)
|
.592ⁿˢ
|
1.112 (1.036–1.194)
|
0.003
|
|
Wealth: Poor
|
1.588 (1.399–1.802)
|
0.000
|
1.574 (1.160–2.135)
|
0.004
|
1.100 (0.896–1.351)
|
.361ⁿˢ
|
1.901 (1.706–2.119)
|
0.000
|
|
Wealth: Middle
|
1.209 (1.064–1.375)
|
0.004
|
1.196 (0.876–1.633)
|
.260ⁿˢ
|
1.117 (0.915–1.363)
|
.279ⁿˢ
|
1.390 (1.246–1.550)
|
0.000
|
|
Mother: No Education
|
1.731 (1.482–2.023)
|
0.000
|
1.093 (0.762–1.568)
|
.628ⁿˢ
|
1.611 (1.274–2.036)
|
0.000
|
2.094 (1.838–2.386)
|
0.000
|
|
Mother: Primary Education
|
1.768 (1.493–2.094)
|
0.000
|
1.231 (0.834–1.816)
|
.295ⁿˢ
|
1.191 (0.906–1.564)
|
.210ⁿˢ
|
1.866 (1.617–2.155)
|
0.000
|
|
Mother: Secondary Edu.
|
1.554 (1.361–1.773)
|
0.000
|
1.157 (0.861–1.554)
|
.334ⁿˢ
|
1.205 (0.993–1.463)
|
.060ⁿˢ
|
1.529 (1.365–1.712)
|
0.000
|
|
Improved Toilet
|
0.957 (0.849–1.079)
|
.475ⁿˢ
|
1.070 (0.803–1.425)
|
.645ⁿˢ
|
1.370 (1.149–1.635)
|
0.000
|
1.141 (1.031–1.263)
|
0.010
|
|
ANC visits = 0
|
0.937 (0.774–1.134)
|
.505ⁿˢ
|
0.576 (0.336–0.988)
|
0.045
|
0.786 (0.571–1.083)
|
.141ⁿˢ
|
0.893 (0.761–1.048)
|
.165ⁿˢ
|
|
Birth Order: 1
|
0.850 (0.755–0.957)
|
0.007
|
0.826 (0.619–1.103)
|
.196ⁿˢ
|
0.899 (0.746–1.084)
|
.265ⁿˢ
|
0.826 (0.746–0.914)
|
0.000
|
|
Birth Order: 2
|
0.965 (0.865–1.075)
|
.515ⁿˢ
|
1.100 (0.852–1.421)
|
.463ⁿˢ
|
0.974 (0.817–1.162)
|
.771ⁿˢ
|
0.992 (0.905–1.087)
|
.863ⁿˢ
|
|
Diarrhea (2 weeks)
|
1.052 (0.882–1.255)
|
.572ⁿˢ
|
0.721 (0.500–1.039)
|
.079ⁿˢ
|
0.841 (0.653–1.084)
|
.181ⁿˢ
|
0.949 (0.821–1.097)
|
.478ⁿˢ
|
|
Min. Dietary Diversity <5
|
0.936 (0.785–1.116)
|
.461ⁿˢ
|
1.431 (0.843–2.429)
|
.184ⁿˢ
|
0.912 (0.698–1.193)
|
.502ⁿˢ
|
1.110 (0.945–1.304)
|
.204ⁿˢ
|
|
RRR: Relative Risk Ratio; CI:
Confidence Interval; p-values marked
with “ⁿˢ” are not statistically
significant (p > 0.05). Significant p
value showed in bold. Reference category
= Normal nutritional status. Reference
groups for categorical variables: Rich
wealth, MDD ≥ 5 food groups, Female
child, Mother’s education = Higher, Age
= 36+ months, Birth order = 3 or more.
|
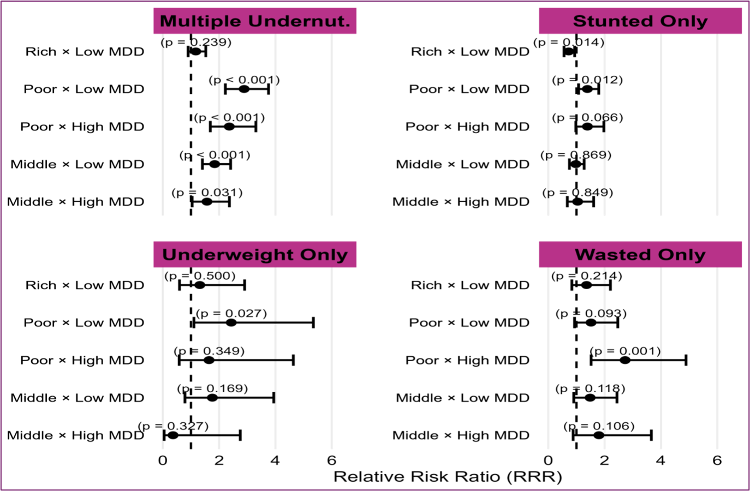
Figure 4 shows the
association between interaction term of Wealth
Index and MDD with nutrition varied by
socioeconomic context. A significant interaction
effect was observed for several outcomes. Among
poor children who did not meet the MDD threshold,
the risk of being stunted was 39% higher (RRR =
1.39; 95% CI: 1.08–1.79; p = .012), and the risk
of being underweight was more than twofold higher
(RRR = 2.43; 95% CI: 1.11–5.35; p = .027),
compared to rich children with adequate diet. Most
notably, the risk of multiple undernutrition was
nearly three times higher among poor children with
low dietary diversity (RRR = 2.89; 95% CI:
2.22–3.75; p < .001) and remained elevated even
among those with higher diversity (RRR = 2.36; p
< .001). In contrast, among children from rich
households, dietary diversity was not
significantly associated with nutritional
outcomes, and in some cases, low MDD even appeared
protective (e.g., RRR = 0.72 for stunting; p =
.014).
|
| Figure
4: Interaction between Dietary Diversity
and Wealth index |
Discussion
The study shows the
evidence that malnutrition in Uttar Pradesh is
shaped by a complex interplay of demographic,
socioeconomic, and maternal factors and diet
diversity with differential effects across types
of undernutrition. This study estimated a low
average MDD of 4.2% among children aged 6–59
months in Uttar Pradesh, with substantial
variation across districts. The finding is
consistent with study by Gunnal et al., who found
that among younger children aged 6 to 23 months,
the central region of India, including Uttar
Pradesh, had a high prevalence of minimum diet
diversity failure (MDDF) of 84.6%. According to
both studies, Uttar Pradesh is a crucial region
for inadequate dietary diversity [8].
Age came about to be
a key determinant of child nutritional outcomes.
Stunting was more common in older children (36–59
months), but wasting and underweight were more
common in younger children (6–23 months), which is
in line with the theory that infections and early
food deficiencies cause acute undernutrition to
appear earlier [9]. Male children were more prone
toward stunting and multiple under-nutrition,
aligned with prior Indian studies attributed this
disparity to gendered feeding practices and
biological susceptibility [10, 11].
All types of
undernutrition were significantly predicted by
household wealth, but multidimensional
undernutrition was almost twice as common in
households with low incomes (RRR = 1.90; p <
.001). Notably, overweight was concentrated among
children from wealthier households, highlighting
India’s double burden of malnutrition [12].
Similarly, low maternal education was
significantly associated with higher risk of all
forms of undernutrition, supporting the well-known
connection between maternal knowledge and child
feeding practices [13].
Remarkably, better
cleanliness by itself predicted a lower incidence
of wasting and multiple undernutrition but was not
substantially linked to stunting or underweight.
This implies that the prevention of acute
nutritional shocks may be more strongly impacted
by sanitation [14].
Better nutritional
outcomes were positively correlated with the
frequency of antenatal care (ANC) visits. Prenatal
contact may be an invaluable opportunity for
maternal nutrition counselling, IFA
supplementation, and health behavior promotion, as
children whose mothers attended four or more ANC
visits were more likely to be overweight and
well-nourished [15]. On the other hand, there was
a gradient effect in birth order, with children of
higher birth order having far higher risks of
multiple undernutrition, probably as a result of
home resource dilution [16].
After controlling
for confounders, our analysis revealed no
statistically significant correlation between
Minimum Dietary variety (MDD) and nutritional
status, despite the increasing focus on dietary
variety as a global IYCF indicator. Still, more
than 90% of undernourished children ate less than
five food groups, indicating a general lack of
adequate nutrition.
A unique finding
revealed from the wealth-MDD interaction analysis
which showed MDD was protective only in wealthier
households. While meeting the MDD criteria, poor
children were more likely to suffer from
undernutrition, particularly multiple
undernutrition (RRR = 2.36; p <.001). This
study indicates only dietary diversity is not
enough to avoid malnutrition in settings with
limited resources, where overall food intake, meal
frequency, and underlying food insecurity could
weigh down the benefits of dietary quality. But in
wealthy families, MDD seems to offer neutral or
even protective benefits, especially when it comes
to stunting (RRR = 0.72; p =.014).
These results are
consistent with recent research warning against
using MDD alone as a stand-in for adequate
nutrition in susceptible groups [17]. Instead, a
multi-sectoral approach like targeting food
security, maternal literacy, sanitation, and
antenatal care is crucial for addressing multiple
forms of child malnutrition. The study also
supports the argument made by de Onis et al. that
dietary indicators should be explaining within the
socioeconomic context [4]. The integration of MDD
into India’s nutritional surveillance must
therefore consider economic disparities, food
environments, and regional dietary patterns.
Strengths and
Limitations: A key advantage of this study is to
use of nationally representative, biomarker-based
anthropometric data from NFHS-5. Unbiased
sub-group analysis is made possible by the high
sample size. However, this study depends on a
24-hour dietary recall, which might limit the
finding.
Conclusion
Undernutrition among
children in Uttar Pradesh is primarily shaped by
socio-economic disadvantages, including
poverty/low maternal education, rather than
dietary diversity alone. While low dietary
diversity is prevalent among undernourished
children, its impact on nutritional status is
especially prominent in poorer households, as the
significant interaction found between wealth and
minimum dietary diversity. Children from
disadvantaged backgrounds who do not meet minimum
dietary diversity thresholds face a significantly
higher risk of multiple forms of undernutrition.
Policy
recommendation: The government
ongoing programs like Integrated Child Development
Services (ICDS)/Poshan Abhiyan have made important
advancement by providing supplementary nutrition
and promoting health services. However, these
programs alone are insufficient to address the
multifaceted nature of undernutrition. The
findings justify and reinforce the need for these
policies to develop by emphasizing not only the
quantity but also the quality/diversity of diets,
promote maternal education and reduce nutritional
disparities in Uttar Pradesh.
Acknowledgements:
We sincerely acknowledge Mahatma
Jyotiba Phule Rohilkhand University, Bareilly,
U.P. for providing the academic support and
guidance and
resources extended throughout
the research.
References
- International Institute for Population
Sciences (IIPS) and ICF. (2021). National
Family Health Survey (NFHS-5), 2019–21: India
(Volume I). Mumbai: IIPS. Available at https://dhsprogram.com/pubs/pdf/FR375/FR375.pdf
- UNICEF. Stop stunting in South Asia: A common
narrative on maternal and child nutrition. 2019.
Available from https://www.unicef.org/rosa/sites/unicef.org.rosa/files/2019-11/StopStuntinginSouthAsia-ACommonNarrativeonMaternalandChildNutrition_UNICEF.pdf
- World Health Organization. Indicators for
assessing infant and young child feeding
practices: Part 1. 2008. Available from https://apps.who.int/iris/bitstream/handle/10665/43895/9789241596664_eng.pdf
- de Onis M, Garza C, Onyango AW,
Rolland-Cachera MF and le Comité de nutrition de
la Société française de pédiatrie. Les standards
de croissance de l'Organisation mondiale de la
santé pour les nourrissons et les jeunes enfants
[WHO growth standards for infants and young
children]. Archives de Pédiatrie. 2009;16(1):47–53.
https://doi.org/10.1016/j.arcped.2008.10.010
- Rajan S, Sawant R, Faas S. Dietary diversity
and malnutrition among children under 5 in
India: DHS Working Papers. The DHS Program.
2024. Available at https://dhsprogram.com/pubs/pdf/WP201/WP201.pdf
- Chatterjee K, Sinha R, Kumar P. Finding
sustainable solutions for childhood
under-nutrition in India: An assessment of
association of childhood under-nutrition with
multiple factors. International Journal of
Community Medicine and Public Health. 2022;9(5):2214–2224.
- The DHS Program. Guide to DHS Statistics:
DHS-7 (Version 2). 2021. pp. 11.25–11.28.
Rockville, MD: ICF. Available at
https://www.dhsprogram.com/pubs/pdf/DHSG1/Guide_to_DHS_Statistics_DHS-7.pdf
- Gunnal G, Bagaria D, Roy S. Regional patterns
in minimum diet diversity failure and associated
factors among children aged 6–23 months in
India. Natl Med J India. 2024;37:181–90.
DOI: 10.25259/NMJI_241_2023
- Victora CG, de Onis M, Hallal PC, Blössner M,
Shrimpton R. Worldwide timing of growth
faltering: revisiting implications for
interventions. Pediatrics. 2010
Mar;125(3):e473-80. doi: 10.1542/peds.2009-1519.
- Kanjilal B, Mazumdar PG, Mukherjee M, Rahman
MH. Nutritional status of children in India:
Household socio-economic condition as the
contextual determinant. International
Journal for Equity in Health. 2010;9(1):19.
https://doi.org/10.1186/1475-9276-9-19
- Corsi DJ, Mejía-Guevara I, Subramanian SV.
Risk factors for chronic undernutrition among
children in India: Estimating relative
importance, population attributable risk and
fractions. Social Science and Medicine. 2016;157:165–185.
https://doi.org/10.1016/j.socscimed.2015.11.014
- Nguyen PH, Scott S, Headey D, Singh N, Tran
LM, Menon P, Ruel MT. The double burden of
malnutrition in India: Trends and inequalities
(2006-2016). PLoS One. 2021 Feb
25;16(2):e0247856. doi:
10.1371/journal.pone.0247856.
- Tariqujjaman M, Hasan MM, Mahfuz M, Hossain M,
Ahmed T. Association between Mother's Education
and Infant and Young Child Feeding Practices in
South Asia. Nutrients. 2022 Apr
5;14(7):1514. doi: 10.3390/nu14071514.
- Humphrey JH. Child undernutrition, tropical
enteropathy, toilets, and handwashing. The
Lancet. 2009;374(9694):1032–1035. https://doi.org/10.1016/S0140-6736(09)60950-8
- Alhassan Y, Otiso L, Okoth L et al. Four
antenatal care visits by four months of
pregnancy and four vital tests for pregnant
mothers: impact of a community-facility health
systems strengthening intervention in Migori
County, Kenya. BMC Pregnancy Childbirth
2024;24:224. https://doi.org/10.1186/s12884-024-06386-2.
- Datar A, Jacknowitz A. Birth weight effects on
children's mental, motor, and physical
development: Evidence from twins data. Maternal
and Child Health Journal. 2009;13(6):780–794.
https://doi.org/10.1007/s10995-009-0461-6
- de Oliveira Otto MC, Anderson CAM, Dearborn
JL, Ferranti EP, Mozaffarian D, Rao G,
Wylie-Rosett J, Lichtenstein AH; American Heart
Association. Behavioral Change for Improving
Health Factors Committee of the Council on
Lifestyle and Cardiometabolic Health and Council
on Epidemiology and Prevention; Council on
Cardiovascular and Stroke Nursing; Council on
Clinical Cardiology; and Stroke Council. Dietary
Diversity: Implications for Obesity Prevention
in Adult Populations: A Science Advisory From
the American Heart Association. Circulation.
2018 Sep 11;138(11):e160-e168.
|


