|
Introduction
Oral
submucous fibrosis (OSMF) is an insidious chronic
disease and one of the most common potentially
malignant conditions seen in the Indian
population.[1,2] It affects most of the soft
tissues of the oral cavity including buccal
mucosa, labial mucosa, tongue, soft palate and
hard palate. The prevalence of OSMF in India has
been estimated with a broad age range from 11-60
years, male to female ratio of 2:1 and with a
malignant transformation rate of 1.5-15% of all
cases.[3]
Though the aetiology
of OSMF is multi-factorial, areca-nut chewing has
been reported to be the most common cause. The
other causative agents include intake of spicy
food, genetic predisposition and nutritional
deficiency.[4,5] OSMF arises due to disturbances
in the homeostatic equilibrium between the
degradation and synthesis of the collagen leading
to fibrosis and other changes.[6]
The diagnosis of
OSMF is usually based on the clinical findings in
patients with a habit of arecanut chewing. Osmf is
clinically characterized by presence of fibrous
bands, altered oral mucosa texture leading to
blanching of mucosa and burning sensation mostly
while having spicy foods. As a result of the
fibrosis of the oral tissues, reduction in mouth
opening and cheek flexibility along with
difficulty in tongue movements, difficulty in
swallowing, decreased salivary flow, and shrunken
uvula will be present in later Stages.[7]
However clinical
examination alone may be subjective and the
severity may be overestimated or underestimated
depending on the clinical experience of the
practitioner. For this reason, severity is
assessed through both clinical and
histopathological staging. Histologically as the
disease progresses, there will be increased
submucosal thickness and hypertrophy of muscles
along with decreased vascularity and epithelial
atrophy due to obliteration of blood vessels.[8]
Increased submucosal thickness is said to be due
to fibrosis which is caused by increased collagen
activity or decreased collagen degradation and
increased activity of proliferation of
fibroblasts. These changes in submucosal thickness
progresses through stages where submucosa cannot
be distinguished from underlying muscle layer.[9]
As it is a diffuse
condition, wrong site for biopsy of the disease is
possible which leads to an improper
histopathological grading. In severe Stages where
the mouth opening is minimal, it is difficult to
take a biopsy and it is not feasible to take
biopsies repeatedly to determine the progression
of the disease and also to check for the
improvement after the treatment is employed. All
these disadvantages can be overcome by using USG
as an adjuvant investigation modality with an
extra-oral approach.
Ultrasonography
(USG) is a non-invasive, non-ionizing, safe,
readily available and cost effective modality for
imaging superficial structures of the head and
neck region.[10] Because of its non-invasive
nature and safety, it has better patient
acceptance.[11,12] In addition, because of the
wider area that can be imaged, USG may be used to
determine the extent and severity of the
involvement of the tissues in OSMF, thus
supplementing clinical and histological details.
Some studies reported that USG can delineate
feeble fibrotic bands before they can clinically
be detected.
The hypothesis
studied in this study is that there is a
significant positive correlation between
submucosal thickness measured by ultrasonography
and the clinical staging of Oral Submucous
Fibrosis. Specifically, it is anticipated that as
the clinical Stage of OSMF progresses from Stage I
to Stage III, the submucosal thickness will
increase correspondingly, reflecting the extent of
fibrosis and disease severity.
So the study aimed
to measure submucosal thickness in OSMF patients
using ultrasonography by quantifying submucosal
thickness at various oral sites in patients
diagnosed with OSMF and comparing these
measurements with the clinical Stages focusing on
analyzing the relationship between the submucosal
thickness values and the clinical Stages of OSMF.
The goal was to determine if there is a
statistically significant correlation between
increasing submucosal thickness and advancing
clinical Stages of the disease.
By establishing this
correlation, the study aimed to determine the
utility of USG as a non-invasive tool for
evaluating the severity of OSMF, thereby enhancing
disease assessment and management.
Material and Methods
The total sample
size for the study was 44. It was a case-control
study including 33 patients clinically diagnosed
with OSMF, categorized into three Stages (Stage I,
II, and III) and 11 healthy controls. This study
was conducted in Department of Oral Medicine and
Radiology, Yenepoya Dental College, Yenepoya
(Deemed to be University), Mangalore, Karnataka
and Department of Radiology, Yenepoya Medical
College, Mangalore, Karnataka, after getting
ethical clearance from the institutional ethical
committee (Protocol no. YEC2/1071). Patients who
were clinically diagnosed with various stages of
OSMF were taken as cases. Healthy individuals with
no other oral lesions and no habit history were
taken as controls. Exclusion Criteria included
patients with known history of restricted mouth
opening owing to causes other than OSMF,
previously treated cases of OSMF, any systemic and
skin diseases which included scleroderma,
amyloidosis, diabetes mellitus and hypertension
and radiation therapy done in the head and neck
region. In this study, the independent variable
was the clinical stages of Oral Submucous Fibrosis
(OSMF), while the dependent variable was the
submucosal thickness measured through
ultrasonography. The analysis also considered age
and sex as covariates.
The USG images were
obtained from the Department of Radiology,
Yenepoya Medical College and Hospital, Yenepoya
deemed to be University, Mangalore using Philips
Clear VUE 850 and a multi-frequency linear
transducer probe with the frequency range from
3-12 Mhz. Each sample of the selected
group was informed about the study in patient’s
known language and informed consent was obtained.
Detailed history was elicited from each subject
and the data was entered into a structured
proforma. The clinical examination was carried out
and patients were divided into Stage I-Early OSMF,
Stage II-Moderate OSMF and Stage III-Severe OSMF.
Healthy individuals with no habit history or any
systemic illnesses were taken as controls. So, in
total the study group consisted of 44 patients (11
cases in each stage of OSMF and 11 controls)
divided into 4 groups (Group 1-Stage 1, Group 2
–Stage 2, Group 3-Stage 3 and Group 4-Controls).
As a part of clinical examination, the maximum
mouth opening was measured using a vernier caliper
(normal distance between central incisor tips) and
cheek flexibility was checked (CF = V1-V2, two
points measured between; V2 = marked at 1/3rd the
distance from the angle of the mouth on a line
joining the tragus of the ear and the angle of the
mouth and V1 = the subject was then asked to blow
his cheeks fully, and the distance measured
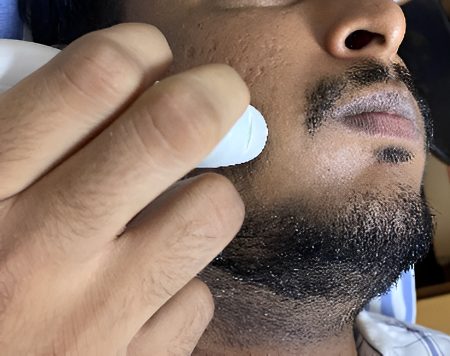
between the two points marked on the cheek). After
this extra oral USG Scanning was performed by a
trained radiologist with the patient in supine
position using a medical sonographic unit Philips
Clear VUE 850 and a multi-frequency linear
transducer probe with the frequency range from
3-12 Mhz.(Fig.1)
|
Fig.1:
Ultrasonic imaging of submucosal thickness
of a healthy control
|
Prior to commencing
imaging, participants were instructed to retain
water in their mouth to outline the empty space
within the oral cavity. The transducer probe was
positioned to avoid excessive compression of soft
tissues, as heightened contact pressure during
imaging could impact measurements. Therefore, to
achieve precise measurements of submucosal
thickness, the probe was gently brought into
contact with the surface. The probe was positioned
along imaginary planes on the buccal mucosa as
follows: longitudinal (outer canthus of the eye to
1cm above the lower border of the mandible) and
transverse (commissure of the lip to the tragus of
the ear). These reference planes were considered
for ultrasonographic imaging of buccal mucosa. For
imaging upper and lower labial mucosa, the
transducer probe will be placed in the mid-region
of philtrum and mentalis region, respectively.
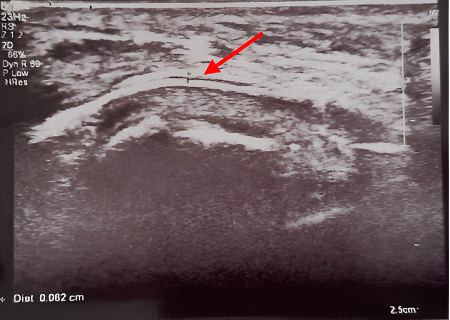
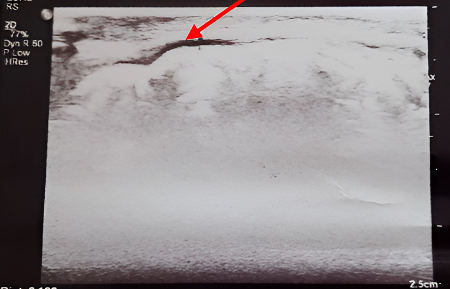
The real-time imaging of submucosa of buccal
and labial mucosa was done(Fig.2a and b)
|
|
Fig.2a:
USG image of measurement of submucosal
thickness of buccal mucosa
|
Fig.2b:
USG image of measurement of submucosal
thickness of labial mucosa |
Ultrasonographic
measurements were taken from six different
locations for each patient i.e right anterior
buccal mucosa, right posterior buccal mucosa, left
anterior buccal mucosa, left posterior buccal
mucosa, upper labial mucosa and lower labial
mucosa. The measurements were taken in
centimetres. The maximum measurement among these
six values for each patient was taken as the
representative value of submucosal thickness for
that patient
Statistical Analyses:
Descriptive
Statistics: The distribution of
participants across different Stages of OSMF was
summarized using counts and percentages for
categorical variables like sex and age groups.
Mean and
Standard Deviation Calculation: For
continuous variables such as submucosal thickness,
the mean and standard deviation were calculated to
assess the central tendency and variability across
different OSMF Stages.
Confidence
Intervals: 95% confidence intervals
were calculated for the mean submucosal thickness
in each Stage to estimate the range within which
the true mean is likely to fall.
Post Hoc
Analysis: Differences in mean
submucosal thickness between the Stages were
evaluated using post hoc comparisons, with
corresponding p-values to determine statistical
significance.
Significance
Testing: The study used p-values to
assess the statistical significance of the
differences in submucosal thickness between
various OSMF Stages, with lower p-values
indicating more significant differences.
Results
|
Table 1: Bivariate analyses of
covariates vs. disease status/staging
|
|
Covariates
|
Categories
|
Stage I (n=11)
|
Stage II (n=11)
|
Stage III (n=11)
|
|
Sex
|
Female (n=1)
|
0 (0.0%)
|
1 (100.0%)
|
0 (0.0%)
|
|
Male (n=43)
|
11 (25.6%)
|
10 (23.3%)
|
11 (25.6%)
|
|
Age
|
<30 (n=8)
|
2 (25.0%)
|
1 (12.5%)
|
1 (12.5%)
|
|
30-50 (n=28)
|
8 (28.6%)
|
6 (21.4%)
|
9 (32.1%)
|
|
≥50 (n=8)
|
1 (12.5%)
|
4 (50.0%)
|
1 (2.5%)
|
Table 1 presents the distribution of sex and age
across different Stages of the OSMF (Stage I,
Stage II, and Stage III). The data is categorized
by sex (female and male) and age groups (<30,
30-50, and ≥50 years), with each category showing
the number of cases (n) and the corresponding
percentage for each Stage.
- Sex: There was one female
participant in Stage II (100.0%). The male
participants were evenly distributed across the
Stages, with 11 males in Stage I (25.6%), 10 in
Stage II (23.3%), and 11 in Stage III (25.6%).
- Age:
- <30 years (n=8): The
youngest age group had 2 participants (25.0%)
in Stage I, 1 participant (12.5%) in Stage II,
and 1 participant (12.5%) in Stage III.
- 30-50 years (n=28): The
majority of participants fell within this age
range. with 8 in Stage I (28.6%), 6 in Stage
II (21.4%), and 9 in Stage III (32.1%).
- ≥50 years (n=8): The oldest
age group showed a distribution where 1
participant (12.5%) was in Stage I, 4
participants (50.0%) were in Stage II, and 1
participant (12.5%) was in Stage III.
|
Table 2: Bivariate analyses of
covariates vs. thickness
|
|
Covariates
|
Categories
|
n
|
Mean and Standard deviation of
thickness
|
|
Control
|
Stage I
|
Stage II
|
Stage III
|
|
Sex
|
Female
|
1
|
-
|
-
|
0.130 (-)
|
-
|
|
Male
|
43
|
0.049 (0.003)
|
0.080 (0.014)
|
0.118 (0.034)
|
0.196 (0.059)
|
|
Age
|
<30
|
8
|
0.050 (0.000)
|
0.080 (0.000)
|
0.110 (-)
|
0.164 (-)
|
|
30-40
|
8
|
0.050 (0.000)
|
0.080 (0.017)
|
0.116 (0.032)
|
0.207 (0.059)
|
|
≥50
|
28
|
0.045 (0.007)
|
0.080 (-)
|
0.125 (0.040)
|
0.123 (-)
|
Table 2 shows the
relationship between different covariates and the
mean submucosal thickness (with standard
deviation) across control and various disease
Stages. The analysis is divided by sex and age:
- Sex:
- There was one female participant, who was in
Stage II, with a mean thickness of 0.130 mm
- The mean submucosal thickness in males
increased progressively across the stages:
Control (0.049 mm), Stage I (0.080 mm), Stage
II (0.118 mm), and Stage III (0.196 mm). The
standard deviation also increased with disease
severity, reflecting greater variability in
thickness in more advanced Stages.
- Age:
- <30
years (n=8): The mean thickness
increased with disease stage: Control (0.050
mm), Stage I (0.080 mm), Stage II (0.110 mm),
and Stage III (0.164 mm).
- 30-40
years (n=8): A similar trend was
observed with increasing thickness from
Control (0.050 mm) to Stage III (0.207 mm),
and increasing variability in thickness as
indicated by the rising standard deviation.
- ≥50
years (n=28): In this age group,
the mean thickness also increased with the
disease stage. (Table 2)
|
Table 3: Bivariate analyses of
the US submucosal thickness and staging.
|
|
Stage
|
Mean
|
95% Confidence Interval for mean
|
Standard Deviation
|
Test statistics
|
p value
|
|
Lower limit
|
Upper limit
|
|
Control
|
0.049
|
0.047
|
0.051
|
0.003
|
50.511
|
<0.0001
|
|
Stage I
|
0.08
|
0.07
|
0.09
|
0.014
|
|
Stage II
|
0.119
|
0.097
|
0.14
|
0.032
|
|
Stage III
|
0.196
|
0.156
|
0.235
|
0.059
|
Table 3 focuses on
the relationship between the mean submucosal
thickness and disease staging, including the 95%
confidence interval for the mean, standard
deviation, and test statistics:
- Control:
The mean thickness was 0.049 mm with a narrow
confidence interval (0.047 mm to 0.051 mm) and a
very low standard deviation (0.003 mm). The test
statistics showed a significant difference in
thickness compared to the other Stages (p <
0.0001).
- Stage I:
Mean thickness increased to 0.08 mm with a
slightly wider confidence interval (0.07 mm to
0.09 mm) and a higher standard deviation (0.014
mm).
- Stage II:
The mean thickness further increased to 0.119
mm, with a wider confidence interval (0.097 mm
to 0.14 mm) and a standard deviation of 0.032
mm.
- Stage III:
The most advanced stage had the highest mean
thickness of 0.196 mm, the widest confidence
interval (0.156 mm to 0.235 mm), and the largest
standard deviation (0.059 mm), indicating
greater variability in submucosal thickness. (Table
3).
|
Table 4: Post Hoc Analysis of US
Submucosal Thickness and Staging
|
|
|
Control
|
Stage I
|
Stage II
|
Stage III
|
|
Control
|
Mean difference
|
—
|
-0.031
|
-0.07
|
-0.146
|
|
p-value
|
—
|
0.00013
|
0.00013
|
0.00005
|
|
Stage I
|
Mean difference
|
|
—
|
-0.039
|
-0.116
|
|
p-value
|
|
—
|
0.01213
|
0.00027
|
|
Stage II
|
Mean difference
|
|
|
—
|
-0.077
|
|
p-value
|
|
|
—
|
0.0084
|
|
Stage III
|
Mean difference
|
|
|
|
—
|
|
p-value
|
|
|
|
—
|
Table 4 provides a
post hoc analysis of the differences in mean
submucosal thickness between different stages,
along with the corresponding p-values to determine
statistical significance:
- Control vs. Stage I: The mean
difference in thickness was -0.031 mm, with a
significant p-value (0.00013).
- Control vs. Stage II: A
larger mean difference of -0.07 mm was observed,
with a similarly significant p-value (0.00013).
- Control vs. Stage III: The
greatest mean difference was -0.146 mm, with an
even more significant p-value (0.00005).
- Stage I vs. Stage II: The
mean difference was -0.039 mm, with a p-value of
0.01213.
- Stage I vs. Stage III: The
mean difference increased to -0.116 mm, with a
highly significant p-value (0.00027).
- Stage II vs. Stage III: The
difference in mean thickness was -0.077 mm, with
a significant p-value (0.0084).
Each comparison
showed statistically significant differences in
submucosal thickness between the different stages
of the disease, suggesting that as the disease
progresses, submucosal thickness increases
significantly (Table 4).
Discussion
Oral submucous
fibrosis (OSMF) represents a significant health
concern in populations where areca nut chewing is
prevalent, particularly in regions like India. Its
insidious nature and potential for malignant
transformation underscore the importance of early
diagnosis, monitoring the progression and
improvement following treatment.
Pre-malignant
lesions and conditions like OSMF are said to
predominantly affect middle-aged to older
individuals with a noticeable male
predominance.[13] In our study, the age range was
found to be between 20-60 years with male
predominance. Out of 33 cases of OSMF included in
the study there was only one female patient
confirming the male predominance. The higher
prevalence of OSMF in males compared to females
can be attributed to various factors such as
higher rates of areca nut and alcohol use among
males in many cultures, which are significant risk
factors for OSMF.[14]
The study found that
the distribution of male participants was
relatively even across all Stages of OSMF, while
there was only one female participant, who was in
Stage II (Table 1). This suggests that
while the progression of OSMF may not differ
significantly between sexes, the limited number of
female participants makes it difficult to draw
definitive conclusions about the impact of sex on
disease progression.
The analysis of age
groups revealed that participants aged 30-50 years
were the most affected, with the majority falling
within this age range across all Stages. This
pattern indicates that OSMF predominantly affects
individuals in their middle ages. The younger
(<30 years) and older (≥50 years) age groups
had fewer participants, but it is notable that the
oldest group showed a higher proportion in Stage
II, suggesting that age might influence the Stage
at which the disease is diagnosed, with older
individuals possibly experiencing more advanced
Stages.
Traditionally,
clinical examination has been the mainstay for
assessing Oral Submucous Fibrosis (OSMF), relying
on subjective observations and measurements.
However, this may not be effective for early
diagnosis before visible signs manifest. Tiwari
et.al[9] and Manjunath K et.al.,[15] in their
studies found that USG can delineate feeble
fibrotic bands before they can clinically be
detected confirming that USG can also be used for
screening of this condition at an early stage.
Biopsy, particularly
incisional biopsy, is often employed to confirm,
know the severity of the disease and Stage them
accordingly or in cases where malignancy is
suspected. This approach may be also limited by
factors such as inter-observer variability and
difficulty in evaluating patients with advanced
disease manifestations, such as severe trismus.
The introduction of ultrasonography as an adjuvant
investigative tool for OSMF offers a promising
alternative, addressing some of the limitations
associated with traditional clinical and
histopathological examination. Ultrasonography
(USG) emerges as a promising non-invasive
technique for assessing OSMF with advantages such
as real-time imaging, non-ionizing radiation, and
the ability to visualize changes in superficial
structures like the buccal and labial mucosa.
The diagnostic
potential of USG in OSMF has been reported by C.
Krithika et al.,[16] and Thapasum AF et al.[1]
where the characteristics of the buccal mucosa was
evaluated using USG. In studies conducted by
Manjunath K et al.,[15], Rashmi Kewal et al.,[10]
and Lakshmi Kavitha et al.,[11] clinical and
histopathological examinations of OSMF were
compared with findings from ultrasonographic
techniques. All of these studies showed that
ultrasonography is an effective adjuvant tool for
OSMF, providing qualitative and quantitative
information without causing discomfort to
patients. However, despite these advantages, the
utility of USG in OSMF patients is still not in
routine use.
Hence the study
aimed to assess and stage OSMF patients based on
clinical signs and symptoms and subsequently
measure the submucosal thickness of buccal and
labial mucosa using ultrasonography thereby
providing quantitative data to supplement clinical
assessments. By comparing these measurements with
those of normal healthy individuals, the study
sought to identify any significant differences in
the submucosal thickness indicative of OSMF.
Furthermore, the research intended to establish a
correlation between the severity of OSMF, as
determined clinically, and ultrasonographic
measurements of submucosal thickness.
By providing
objective measurements of submucosal thickness,
ultrasonography offers a more standardized
approach to assessing disease severity. The
results of this study also revealed submucosal
thickness increased significantly with disease
progression. In males, as well as across various
age groups, the mean thickness rose from 0.049 mm
in the control group to 0.196 mm in Stage III.
This increase was accompanied by a rise in
standard deviation, indicating greater variability
in thickness at more advanced stage. The results
suggest that submucosal thickness serves as a
reliable indicator of disease severity in OSMF and
were consistent with the results of the studies
conducted by Devathambi et.al.,[2]and Lakshmi
Kavitha et.al., [11] which also showed an increase
in submucosal thickness as OSMF stages advanced
compared to controls. Importantly, age did not
significantly affect the pattern of submucosal
thickening. The progression of submucosal
thickness was primarily driven by the disease
stage rather than by age. Due to the uneven
distribution of samples between sexes, broad
conclusions about the impact of sex on submucosal
thickness could not be drawn.
It was also found in
the current study that, two patients clinically
staged as Stage I had markedly increased
submucosal thickness compared with the other Stage
I patients which is a finding not reported in any
of the past studies. This indicates the
possibility that USG can show us the precise
severity level of the disease through the layers
of the mucosa even when the progression and
severity of the disease is not visible clinically.
The post hoc
analysis also confirmed that the differences in
submucosal thickness between stages were
statistically significant. Each stage showed a
marked increase in thickness compared to the
previous one, with the most significant
differences observed between the control group and
Stage III. These findings reinforce the utility of
submucosal thickness as a quantitative measure for
assessing the progression of OSMF.
The current study
aligns partially with the findings of Rangaiah et
al.,[17], who observed elevated submucosal
thickness at the anterior and posterior buccal
mucosa as well as the upper and lower labial
mucosa in OSMF cases compared to controls.
However, they found no significant relationship
between ultrasonography (USG) findings and
clinical assessments, largely due to a higher
proportion of subjects in clinical Stages III
(50%) and IVa (20%). Kumar et al.[8] reported
similar study results, noting a notable rise in
submucosal thickness among OSMF cases compared to
controls. However, they encountered challenges in
establishing statistical significance across
stages and ultrasonographic findings due to a
heterogeneous distribution of cases across the
stages. In contrast, our study observed a
significant correlation between OSMF stages and
ultrasonographic findings, which can be attributed
to a more uniform distribution of cases across all
OSMF groups.
Additionally, it was
also observed that some patients had difference in
submucosal thickness between different sides and
sites. This difference was attributed to the
reason that some of these patients had the habit
of retention and chewing arecanut more on one side
compared to the other side, more anteriorly than
posteriorly and vice versa, leading to
comparatively increased thickness on the side and
site of maximum chewing and retention. The site of
retention and chewing influences the extent of
fibrosis and hence justifies the difference in
thickness at different sites in the same patient.
This is the reason why in our study, the maximum
measurement of submucosal thickness was taken as
the representative value for all the patients.
From all these above
mentioned findings, the current study aligns with
existing literature that demonstrates the
potential of ultrasonography as a valuable
adjunctive tool in assessing and monitoring OSMF
progression. The observed increase in submucosal
thickness with advancing disease stages is
consistent with prior findings, highlighting the
progressive nature of OSMF.
Moreover, the
non-invasive nature of ultrasonography makes it a
safe and well-tolerated imaging modality, suitable
for repeated evaluations over time. This allows
for longitudinal monitoring of disease progression
and treatment response, facilitating early
intervention and personalized patient care.
Additionally, ultrasonography may offer advantages
in cases where traditional biopsy techniques are
challenging or contraindicated. Further research
and clinical validation are warranted to fully
establish the utility of USG in OSMF effectively.
The findings of this
study underscore the clinical significance of
utilizing ultrasonography as an adjuvant tool in
OSMF. Traditional clinical examination alone may
not provide sufficient information to accurately
characterize disease severity. By incorporating
ultrasonographic measurements of submucosal
thickness, clinicians can obtain quantitative data
to correlate with clinical staging. The ability to
correlate ultrasonographic measurements with
clinical staging can facilitate a more
comprehensive understanding of disease progression
and treatment response.
Acknowledgments And
Disclosure Statements
The authors would
like to extend our sincere thanks to Mrs.
Yashaswini for her tremendous guidance for the
statistical analyses. The authors report no
conflicts of interest related to this study.
References
- Thapasum AF, Rangdhol V, Mohammed F, Mohamed
S, Shanmugam S. Gray-scale ultrasonographic
imaging of the buccal mucosa in various Stages
of oral submucous fibrosis. Oral Radiol 2015;31:143-148.
- Devathambi JR, Aswath N. Ultrasonographic
evaluation of oral submucous fibrosis and
masseteric hypertrophy. J Clin Imaging Sci 2013;3.
- Shih YH, Wang TH, Shieh TM, Tseng YH: Oral
submucous fibrosis: a review on
etiopathogenesis, diagnosis, and therapy. Int
J Mol Sci 2019;20:2940.
- Pindborg JJ. Oral submucous fibrosis: a
review. Ann Acad Med Singap
1989;18:603-607.
- Gupta P, Hebert JR, Bhonsle RB, Sinor PN,
Mehta HC, Mehta FS. Dietary factors in oral
leukoplakia and submucous fibrosis in a
population-based case-control study in Gujarat,
India. Oral Dis 1998;4:200-206.
- Dangore-Khasbage S, Bhowate RR, Khubchandani
M, Bhowate R. Chemical composition of areca nut
and its adverse effects on human health. Cureus
2023;15.
- Ahmad MS. Epidemiological and etiological
study of oral submucous fibrosis among Gutkha
chewers of Patna, Bihar, India. J Indian Soc
Pedod Prev Dent 2006;24:84-88.
- Kumar DK, Anekar DJ, Chirakara DR. Assessment
of oral submucous fibrosis using ultrasound as
an adjunct to clinical evaluation. Int J
Dent Oral Sci 2021;8:5042-5048.
- Tiwari M, Deoghare A, Sharma A, Saha S,
Poptani R, Evaluation of OSMF with
Ultrasonography. Int J Oral Health Dent 2017;3(3):169-174
- Agarwal RK, Hebbale M, Mhapuskar A, Tepan M.
Correlation of ultrasonographic measurements,
histopathological grading, and clinical staging
in oral submucous fibrosis. Indian J Dent
Res 2017;28:476.
- Nadendla LK, Tatikonda VK, Bangi BB, Bhayya H,
Devulapally RV, Pokala A. Sonographic imaging of
fibrosis of oral mucosa and its correlation with
clinical staging in oral submucous fibrosis. J
Cancer Res Ther 2018;14:394.
- Dupare A, Dhole A. Ultrasonographic evaluation
of submucosal thickness in oral submucous
fibrosis patients: a cross-sectional study. Pol
J Radiol. 2018 Jun 14;83:e280-e288.
- Rajendran R, Nair SM. Silver binding nucleolar
organizer region proteins (AgNORs) as a possible
prognostic indicator in oral submucous fibrosis.
Oral Surg Oral Med Oral Pathol 1992;74:481-486.
- Sowmya S, Sangavi R. Prevalence of oral
submucous fibrosis with other oral potentially
malignant disorders: a clinical retrospective
study. Cureus 2023;15.
- Manjunath K, Rajaram PC, Saraswathi TR,
Sivapathasundharam B, Sabarinath B, Koteeswaran
D. Evaluation of oral submucous fibrosis using
ultrasonographic technique: a new diagnostic
tool. Indian J Dent Res 2011;22:530.
- Krithika C, Ramanathan S, Koteeswaran D,
Sridhar C, Satheesh Krishna J, Shiva Shankar MP.
Ultrasonographic evaluation of oral submucous
fibrosis in habitual areca nut chewers. Dentomaxillofac
Radiol 2013;42:20120319.
- Rangaiah P, Annigeri RG, Lingappa A.
Transcutaneous ultrasonographic assessment of
oral submucous fibrosis: a preliminary study. Int
J Oral Med Sci 2010;9:137-147.
|


