|
Introduction
Cesarean
section is the delivery of fetus through abdominal
uterine incision after fetal viability, 28 weeks
and above. The rising cesarean section is a global
concern, and the rate has exceeded 30% in some
regions. As per the World Health Organization
(WHO) statement in the year 1985, C-section rate
higher than 10–15% is not justified for any
region.(1) Even after thirty years of the
publication of the WHO guidelines in the year
2015, there is no consensus about the optimal CS
rate and appropriate interpretation of this
indicator remains a topic of debate.(2) More
recent efforts to determine the optimal C-section
rate also had limitations due to lack of external
validity and confounders.(2,3) The most common
complications associated with cesarean sections
are increased requirements of blood transfusions,
retained placenta, postpartum hemorrhage,
prolonged hospital stays and increased changes of
maternal morbidity and mortality. (4, 5) Rising
trends in C-section rates are feared to implicate
lower threshold of labour pains maternal requests,
labour induction without indications and lesser
levels of expertise adopting instrumental
deliveries.(6-8)
There are several
reasons which explain variations in institutional
rates of C-section. These include the inherent
differences in patient characteristics, type of
institution and available resources. In addition,
institutional differences in obstetric practice
and pregnancy and labor management protocols can
account for this variation. (6) Therefore,
population-based C-section rates should not be
considered as recommended targets at facility
level. Indeed, systems designed to monitor
cesarean section rates at facilities should
consider these differences. C-section rates should
no longer be thought of being too high or too low
but rather whether they are appropriate. Thus,
C-section should only be conducted based on
medical indications, and efforts should be
directed towards improving access to all women in
need rather than striving to achieve an arbitrary
rate.(6,7) Therefore, policymakers, program
managers, clinicians, and administrators need a
standardized and internationally accepted
classification system to monitor and compare
C-section rates in a meaningful, reliable, and
action-oriented manner. (8) A systematic review of
existing C-section classification system conducted
in 2011 identified 27 different classification
systems of which Robson’s Ten Group Classification
System (RTGCS) was found to be the best
option.(5-6, 9) Vaginal Birth After Cesarean
(VBAC) is a safe alternative to repeat cesarean
section for both mother and infant. The major risk
of trial of labour is uterine rupture and possible
hysterectomy can be reduced by careful patient
selection. The Royal college of obstetricians and
gynecologists recommends the routine use of VBAC
checklist during antenatal counseling as they
would ensure informed consent and shared decision
making in women undergoing VBAC.(10-12) WHO
proposed Robson’s Ten Group Classification System
to monitor and compare the rates of C-section
between different health institutions in a
reliable and action-oriented manner there are many
studies that have shown a small reduction in
C-section rates following implementation of
Robson’s Classification system (Table 1).
The objective of
the current study was to audit C-section rate
using Robson’s Ten Group Classification System in
our tertiary care hospital, and to identify the
main contributors of each subgroup to overall
C-section rate.
Materials and Methods
Study design
This was a
cross-sectional study conducted at out tertiary
care center, Karpaga Vinayaga Institute of Medical
Sciences and Research Centre (KIMS&RC),
Madhuranthagam, Tamil Nadu, India during the
period of January 2019 to December 2021. The study
was conducted by reviewing the hospital record for
analyzing the C-sections performed during the
above-mentioned period. The study population
include the pregnant women who underwent
C-sections in our hospital during the specified
period. Study was approved by the Institutional
Ethical committee of KIMS&RC after the
approval from Scientific Advisory Committee.
Sample size was calculated based on the study done
by Radhakrishnan T et al on “increasing trend of
caesarean rates in India: evidence from NHFS 4”
which showed prevalence of caesarean section rates
of Tamil Nadu as 34%. (13)
Inclusion Criteria: The study
population included all women who gave birth from
January 2019 to December 2021.
Exclusion
Criteria: Laparotomy done for uterine
rupture and deliveries before fetal viability were
excluded from the study. Case sheets with missing
information were also excluded from the study.
Viability is considered after gestational age of
28 weeks or birth weight ≥ 1,000g, if gestational
age is unknown. (14, 15)
Information
regarding each C-section case was obtained from
hospital records of Medical records Department.
Using the medical registration number, we accessed
all C-sections performed during the study period
and all the required details of each case was
noted (Age, Parity, Gestational age, fetal
presentation, previous deliveries, onset of
labour, mode of delivery, birth weight etc.).
Distribution of all cesarean deliveries was then
categorized as per Robson’s Ten Group
Classification System (Table 1).(5,6, 8) The
C-section rate in percentage of total delivery and
contribution of each group to overall C-section
rate was calculated.
|
Table 1: Robson
ten group delivery classification system
|
|
Groups
|
Description
|
|
Group 1
|
Nulliparous,
singleton, cephalic, term spontaneous
labor.
|
|
Group 2
|
Nulliparous,
singleton, cephalic, term, induced labor
or C-SECTION before labor.
2a- Nulliparous, singleton, cephalic, ≥ 37
weeks’ gestation, induced labor.
2b- Nulliparous, singleton, cephalic, ≥ 37
weeks’ gestation, cesarean section before
labor.
|
|
Group 3
|
Multiparous
(excluding previous cesarean section),
singleton, cephalic, ≥ 37 weeks’
gestation, in spontaneous labor.
|
|
Group 4
|
Multiparous
without a previous uterine scar, with
singleton, cephalic pregnancy, ≥ 37 weeks’
gestation, induced or cesarean section
before labor.
4a- Multiparous without a previous uterine
scar, with singleton, cephalic pregnancy,
≥ 37 weeks’ gestation, induced labor.
4b- Multiparous without a previous uterine
scar, with singleton, cephalic pregnancy,
≥ 37 weeks’ gestation, cesarean section
before labor.
|
|
Group 5
|
Multiparous,
Singleton, Cephalic, term with a previous
C-section.
|
|
Group 6
|
Nulliparous,
Singleton, breech.
|
|
Group 7
|
All
multiparous with a single breech
(including previous cesarean section).
|
|
Group 8
|
Multiple
pregnancies.
|
|
Group 9
|
Singleton
pregnancy in transverse or oblique lie.
|
|
Group 10
|
Singleton,
cephalic, preterm pregnancies (including
previous cesarean section).
|
The overall
caesarean section rate was calculated, and the
major contributing factor was also identified. The
contribution of each group to caesarean section
rate was calculated.
Statistical
Analysis: All the data was recorded in an
excel sheet and exported for analysis using IBM
SPSS, version 16.0 (IBM Corp., USA). The overall
C-section rate at the institution was calculated
first. We coded all abstracted data and women were
categorized into one of the ten Robson groups. For
each group, size relative to the entire obstetric
population, contribution to the overall C-section
rate, and C-section rate within the group were
calculated.
Results
The total number of
women meeting the inclusion criteria and delivered
during the period of study were 401. The overall
caesarean section rate during the period of study
was 46%. The 401 antenatal mothers who underwent
C-section were in the age range of 18 to 38 years
and maximum number of women were aged between
21-30 years (68%). The mean age of participants
was 25.4 ± 5.2 years.
Of the overall 401
antenatal women who has C-section 46% were
primigravida and rest were multigravida (54%). The
401 women who underwent C-section, 93% were term
patients and 7% were pre-term. In the study 99%
women presented with singleton pregnancies and 1%
with multiple pregnancies (Table 2).
|
Table 2:
Baseline characteristics of the study
population
|
|
Parameter
|
No. of Cases
|
Percentage
|
|
Parity
|
|
|
|
Primigravida
|
185
|
46%
|
|
Multigravida
|
216
|
54%
|
|
Gestational age
|
|
Pre-term
|
28
|
7%
|
|
Term
|
373
|
93%
|
|
No. of foetus
|
|
Single
|
397
|
99%
|
|
Multiple
|
4
|
1%
|
|
Onset of labour
|
|
Emergency
|
298
|
15%
|
|
Elective
|
132
|
33%
|
|
Fetal Presentation
|
|
Cephalic
|
382
|
95%
|
|
Breech
|
15
|
4%
|
|
Transverse/Oblique Lie
|
4
|
1%
|
|
Birth Weight
|
|
<2500
|
68
|
17%
|
|
2500–4000
|
307
|
77%
|
|
>4000
|
26
|
6%
|
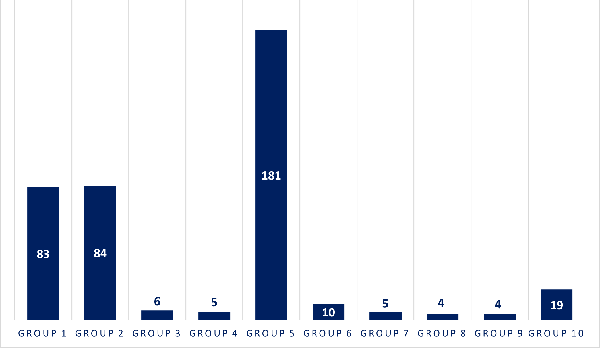
The 401 women who
underwent C-section were classified in RTGCS, 45%
women in Group 5 and it contributed to the maximum
number of the total C-section rates. The second
highest contributor was Group 1 and Group 2
contributing to 41% of the overall C-section
rates. Other groups who underwent C-section,
mentioned in the Table 3 and Figure 1.
|
Table 3:
Classification of studied population as
per Robson Ten Group Classification
System
|
|
Robson TGCS
|
Percentage of antenatal women
|
|
Group 1
|
21%
|
|
Group 2
|
21%
|
|
Group 3
|
1%
|
|
Group 4
|
1%
|
|
Group 5
|
45%
|
|
Group 6
|
2%
|
|
Group 7
|
1%
|
|
Group 8
|
1%
|
|
Group 9
|
1%
|
|
Group 10
|
5%
|
|
| Figure
1: Shows the no. of antenatal
women as per Robson Ten Group
Classification System |
Out of 401 women
analyzed, 298 were emergency LSCS (74%) and 103
were elective LSCS (26%). 95% patients who
underwent caesarean section had no complications
and 5% of patients had complications like
postpartum hemorrhage, blood transfusion and
postpartum eclampsia. Totally 407 live babies were
delivered including twin births. Maximum number of
babies weighed between 2500 gm - 4000 gm (77%)
(Table 2). The commonest cause for NICU admission
was preterm birth. Other causes were distress at
birth and grunting.
Discussion
C-section is a key
intervention used to decrease maternal and
neonatal morbidity and mortality. (4-6) Despite
its proven benefits, complications such as
infection, bleeding, anesthetic accidents and even
death are associated with C-section. Further,
future pregnancies can be complicated by
spontaneous preterm birth, uterine rupture, and
abnormal placentation.(16,17) The Robson ten group
classification system enables institution-specific
monitoring and auditing and can be a powerful tool
to inform practice across different settings.
(6-8) In the present study RTGCS was used for
assessing the proportion of each group in the
obstetric population, the contribution of
C-section in each group to the overall C-section
rate. The present study includes 401 mothers who
underwent C-section. Among all the groups as per
Robson’s TGCS classification, Group 5 contributed
to the maximum C-section rates followed by Group 1
and Group 2. This indicates high C-section rate
both in primary (groups 1 and 2) and secondary
(group 5) C-sections. Our study findings are
similar to the study done by Ray A et al and
Abubeker FA et al in Ethiopia, the overall
C-section rate was 28.9% and 30.8% respectively
and Group 10, group 2 and group 5 contributed to
maximum to caesarean section rates, 19.1%, 18.3%
and 17.1% respectively of the overall C-section
rates. (18, 19) Similarly, our study findings are
in line with a study done in India where Group 1,
Group 2 and Group 5 contributed to 19% and 18% of
all deliveries respectively.(20,21)
Cesarean section
performed at a rate higher than 10-15% in absence
of a clinical justification do not reduce maternal
or infant mortality rates. A study performed in
China, the maternal morbidity and mortality were
lower following VBAC compared with repeated
cesareans, but the opposite was seen among
Canadian women. Many hospital-based studies adapt
Robson’s TGCS for monitoring C-section rates the
group 5 is the major contributor to overall
C-section rates and found to be the high-risk
group by several studies which is also seen in the
present study. Mittal et al., reported the
C-section trend using Robson classification in
north India to assess the trend of C-section rate
for 3 years and should a static rate of C-section
in each group over the years.(20) In the study
conducted by Kacerauskiene at al reaudit of
cesarean deliveries should a significant reduction
in overall C-section rate from 26.9% in 2012 to
22.7% in 2014(P<0.001).(21) Study by Ray at al
has found that women with previous C-section
contributes maximum to overall C-section rates
followed by term nulliparous who are induced or
underwent C-section before labour.(20) In a
Canadian study using Robson’s classification most
of the obstetric population attributed to group
6(36.6%) and groups 2 and 1 ranked as second and
third largest contributors (15.7 and 14.1%
respectively).
Several studies
across different settings identified Group 5 as
the leading contributor to the C-section
rate.(13,14,16) In our study, Group 5 was the
largest contributor to the overall C-section rate.
These findings are suggestive of moderately high
C-section rate.(7) which need attention. Though
the safety and long-term benefits of vaginal birth
after cesarean (VBAC) are well established, 45% of
women in Group 5 underwent repeat C-section (Table
3). Thus, there is a need to evaluate the
proportion of women who were offered a trial of
labor and the success rate of VBAC. This will
enable the design and implementation of antenatal
counseling strategies and labor management
protocols, reducing the number of repeat
C-section.
The limitations of
this study, as such are the limitations of
Robson’s ten group classification system. It does
not classify caesarean sections done for specific
conditions like major degree placenta previa and
those done for maternal request. It also does not
classify caesarean sections done for medical,
other obstetric complication in the mother and
those C-section done for fetal indications E.g:
Anhydramnios. As the present study has audited
only indications for C-section, it was unable to
analyse the total number women in that group and
the overall percentage of women in that group
requiring C-section versus those who had vaginal
delivery which would have added more meaning to
the audit.
Conclusion
Robson’s TGCS
server as an important tool for auditing C-section
and can easily implemented at institutional levels
for comparison of C-section rates. As fetal
distress is one among the common indication for
primary caesarean section and electronic fetal
monitoring is the norm, it is important that all
obstetricians in the institute are well trained in
interpreting of cardiotocography (CTG). The
residents must be well trained in procedures like
external cephalic version, assisted breech
delivery and operative vaginal delivery efforts to
reduce overall C-section rate should focus on
reducing primary C-section rate and increasing
VBAC.
Acknowledgement
The authors would
like to acknowledge the medical record section of
KIMS&RC for allowing to access the case record
files. Authors would like to thank Trustee,
Managing Director Dr.R. Annamalai M.S.,M.Ch., for
his support in accomplishing this project.
References
- World Health Organization. Appropriate
technology for birth. Lancet
1985;2: 436–437.
- World Health Organization. Human Reproduction
Programme, 10 April 2015. WHO statement on
caesarean section rates. Reprod Health
Matters 2015; 23:149–150.
- Betran AP, Ye J, Moller AB, et al. The
increasing trend in caesarean section rates:
global, regional and national estimates:
1990-2014. PLoS One 2016; 11:e0148343.
- Ye J, Zhang J, Mikolajczyk R, et al.
Association between rates of caesarean section
and maternal and neonatal mortality in the 21st
century: a worldwide population-based ecological
study with longitudinal data. BJOG
2016; 123:745–753.
- Robson M, Hartigan L, Murphy M. Methods of
achieving and maintaining an appropriate
caesarean section rate. Best Pract Res
Clin Obstet Gynaecol.
2013;27(2):297–308.
- Robson MS. Classification of caesarean
sections. Fetal Matern Med Rev
2001;12(1):23–39.
- Torloni MR, Betran AP, Souza JP, Widmer M,
Allen T, Gulmezoglu M, Merialdi M.
Classifications for cesarean section: a
systematic review. PLoS One 2011;
6(1):e14566.
- Dhodapkar SB, Bhairavi S, Daniel M, Chauhan
NS, Chauhan RC. Analysis of caesarean sections
according to Robson’s ten group classification
system at a tertiary care teaching hospital in
South India. Int J Reprod Contracept Obstet
Gynecol 2017;4(3):745-749.
- Tanaka K, Mahomed K. The ten-group Robson
classification: a single centre approach
identifying strategies to optimise caesarean
section rates. Obstet Gynecol Int.
2017;2017: 5648938. doi: 10.1155/2017/5648938.
- Harrison MS, Pasha O, Saleem S, Ali S, Chomba
E, Carlo WA, Garces AL, Krebs NF, Hambidge KM,
Goudar SS. A prospective study of maternal,
fetal and neonatal outcomes in the setting of
cesarean section in low-and middle‐income
countries. Acta Obstet Gynecol Scand
2017;96(4):410–420.
- Costa ML, Cecatti JG, Souza JP, Milanez HM,
Gulmezoglu MA. Using a Caesarean Section
Classification System based on characteristics
of the population as a way of monitoring
obstetric practice. Reprod Health
2010; 26(7): 13. doi: 10.1186/1742-4755-7-13.
- Litorp H, Kidanto HL, Nystrom L, Darj E, Essen
B. Increasing caesarean section rates among
low-risk groups: a panel study classifying
deliveries according to Robson at a university
hospital in Tanzania. BMC Pregnancy
Childbirth 2013;13:107.
https://doi.org/10.1186/1471-2393-13-107.
- Radhakrishnan T, Vasanthakumari KP, Babu PK.
Increasing trend of caesarean rates in India:
evidence from NFHS-4. Journal of Medical
Science and Clinical Research
2017;5(8):26167-26176.
- Triunfo S, Ferrazzani S, Lanzone A, Scambia G.
Identification of obstetric targets for reducing
cesarean section rate using the Robson Ten Group
Classification in a tertiary level hospital.
Eur J Obstet Gynecol Reprod Biol
2015;189:91–95.doi:
10.1016/j.ejogrb.2015.03.030.
- Sah S, Goel R, Goel JK. Analysis of caesarean
section rate according to Robson’s criteria in
tertiary care centre. International
Journal of Reproduction Contraception
Obstetrics Gynecology
2018;7(8):3060–3064.
- Mittal P, Pandey D, Suri J, Bharti R. Trend
prediction for cesarean deliveries based on
Robson classification system at a tertiary
referral unit of north India. J Obstet
Gynecol India. 2020;70(2):111-118.
- Kacerauskiene J, Bartusevicience E, Railaite
DR,et al. Implementation of the Robson
classification in clinical practice: Lithuania’s
experience. BMC Pregnancy Childbirth.
2017;17:432.
https://doi.org/10.1186/s12884-017-1625-9
- Ray A, Jose S.Analysis of cesarean section
according to Robson’s ten group classification
system and evaluating the indications within the
groups. Int J Reprod Contracept Obstet
Gynecol 2017;6(2):447-451.
- Abubeker FA, Gashawbeza B, Gebre TM,
Wondafrash M et al. Analysis of cesarean section
rates using Robson ten group classification
system in a tertiary teaching hospital, Addis
Ababa, Ethiopia: a cross-sectional study. BMC
Pregnancy Childbirth 2020;20:767.
https://doi.org/10.1186/s12884-020-03474-x.
- Tura AK, Pijpers O, de Man M, et al. Analysis
of caesarean sections using Robson 10-group
classification system in a university hospital
in eastern Ethiopia: a cross sectional study. BMJ
Open 2018;8(4):e020520. doi:10.1136/
bmjopen-2017-020520.
- Jose J, Arumugam SC, Habeebullah S. An audit
of caesarean section rate based on Robson’s ten
group classification system. Int J Reprod
Contracept Obstet Gynecol
2020;9:2803-2807.
|


