|
Introduction
Healthcare
expenditure plays a crucial role in determining
the quality and accessibility of healthcare
services within a country. However, Healthcare
must be a priority, which calls for either more
spending and investment or a more proactive
approach to boosting individual state economies so
that more money can be allocated to healthcare
sector development [1]. Public healthcare services
significantly influence people's health status,
and public healthcare infrastructure is one of the
key factors affecting health outcomes in a nation
[2]. To enhance India's ranking on the human
development index, the Indian government must
manage its public expenditures effectively [3]. In
India, the healthcare sector is confronted with
numerous challenges, including a vast and diverse
population, inadequate infrastructure, and limited
financial resources. The allocation of healthcare
expenditure across different states can vary
significantly, reflecting variations in economic
development, healthcare infrastructure, and health
outcomes [4]. Understanding the patterns of
healthcare expenditure in Indian states is
essential for formulating effective policies and
interventions to improve healthcare delivery and
ensure equitable access to healthcare services.
Healthcare expenditure is a fundamental aspect of
healthcare systems worldwide, serving as a key
determinant of healthcare outcomes and access to
quality care [5]. In the context of India, a
country with a population of over 1.3 billion
people and immense diversity, healthcare
expenditure patterns are critical in addressing
the healthcare needs of its states and population
[6].
India's healthcare
system is characterized by a complex mix of public
and private sector participation, with varying
degrees of resource allocation and service
delivery. The Indian government has made efforts
to improve healthcare infrastructure and services,
notably through initiatives such as the National
Health Mission and the Ayushman Bharat scheme.
Investment in health expenditure has a positive
degree of long-run correlation with life
expectancy rate, while it is negatively associated
with the infant mortality rate [7]. However,
challenges persist, including disparities in
healthcare expenditure across states, inadequate
public healthcare infrastructure, and financial
constraints. The allocation of public funds to the
healthcare sector is a crucial determinant of
healthcare expenditure. Governments at the state
and central levels need to prioritize healthcare
spending in the NER states to bridge the
healthcare infrastructure gaps and improve access
to quality healthcare services. Increased
government spending on healthcare can lead to
better healthcare outcomes and increased
expenditure overall. To gain insights into the
allocation of healthcare expenditure in Indian
states, it is essential to examine comprehensive
data that may, directly and indirectly, captures
the healthcare spending patterns. Such data can
include government budgetary allocations, total
revenue collection, total social expenditure as
well as debt and fiscal deficit accounts.
Analyzing this data enables policymakers and
researchers to assess the adequacy and efficiency
of healthcare spending, identify areas of
improvement, and develop evidence-based strategies
to enhance healthcare delivery and access.
This study aims to
explore the macroeconomic policy impact on
healthcare expenditure patterns in northeast
India. By examining the trends and variations in
healthcare expenditure, we can gain valuable
insights into the resource allocation dynamics and
identify potential areas for policy interventions.
Materials and Methods
Utilizing the data
from the Economic and Political Weekly Research
Foundation, the present study included eight NER
states of India, namely Arunachal Pradesh, Assam,
Manipur, Meghalaya, Mizoram, Nagaland, Sikkim and
Tripura, for the period of 1990-91–2019-20. The
chosen fiscal variables, including total social
sector expenditure, per-capita gross state
domestic product, total revenue receipts, and
states’ own and non-tax revenue, are regarded as
macroeconomic factors of an economy and may have a
positive impact on healthcare spending. In
contrast, variables like internal debt and the
fiscal deficit may have a negative impact on
healthcare spending.
|
Table 1: Summary
Statistics
|
|
Variable(s)
|
Description
|
Mean
|
Max
|
Min
|
Std. Dev.
|
Correlation
|
|
PHE
|
Public Health Expenditure to GSDP
|
1.329
|
6.208
|
0.160
|
0.064
|
1
|
|
TSE
|
Total Social Expenditure to GSDP
|
8.540
|
26.820
|
1.136
|
0.323
|
0.925
|
|
PCGSDP
|
Per Capita Gross State Domestic Product
|
57986.911
|
292235
|
15060
|
2918.165
|
0.395
|
|
TRR
|
Total Revenue Receipts to GSDP
|
29.947
|
97.122
|
2.582
|
1.210
|
0.847
|
|
SOTR
|
States’ Own Tax Revenue to GSDP
|
2.454
|
10.958
|
0.081
|
0.131
|
0.641
|
|
NTR
|
States’ Own Non Tax Revenue to GSDP
|
3.666
|
41.736
|
0.313
|
0.512
|
0.005
|
|
IND
|
Internal Debt to GSDP
|
15.392
|
49.595
|
0.593
|
0.720
|
0.694
|
|
GFD
|
Gross Fiscal Deficit to GSDP
|
2.925
|
13.049
|
-5.764
|
0.194
|
0.278
|
|
CGR
|
Central Grants
|
23959.333
|
207056.1
|
963.3
|
1792.744
|
0.360
|
|
Source: Authors’
Calculation based on EPWRF data series
(1990-91 to 2019-20).
|
Table 1 represents
the description and summary statistics of the
selected variables, which shows that the mean of
PHE is 1.329 per cent while the mean of total
revenue receipts is 29.947 per cent. There is a
huge difference in the maximum and minimum value
of total revenue receipts and PHE, respectively.
It shows that most of the tax revenue across the
states is derived from the low contribution of
states’ own tax revenue. Huge differences have
been also observed in maximum and minimum value of
internal debt and gross fiscal deficit, indicating
inter-state variation over time. Besides, positive
correlation is found between PHE with other
explanatory variables such as TSE, PCGSDP, TRR,
SOTR, NTR, CGR, as well as IND and GFD (as
described in Table 1).
All the variables are taking the base year of
2011–2012 at constant prices.
Prior to
formulating the VECM model for the analysis, the
following model has been used, covering the nine
variables as mentioned in (Table 1):
PHE = β0+
β1TSEit+ β2PCGSDPit
+ β3TRRit + β4SOTRit
+ β5NTRit + β6INDit
+ β7GFDit + β8CGRit
+ µit(1)
Sigma
Convergence Analysis
To check the
convergence tendency of the variables of public
healthcare expenditure and the macroeconomic
variables, such as total social sector
expenditure, per capita GSDP, total revenue
receipts, states’ own tax revenue and
non-tax-revenue, internal debt, fiscal deficit and
central grants to states, sigma convergence
analysis has been applied. The sigma “σ”-
convergence approach can be employed, through the
help of the coefficient of variation (CV) over
time. For the present case, all the eight North
Eastern states were taken together to examine
their tendency of convergence/divergence trend
from 1990-91 to 2019-20. The following formula has
been used for the analysis:
 (2)
(2)
In this context,
'n' denotes the total number of objects,
specifically referring to the eight states under
consideration. 't' represents the specific year
being discussed, while 'i' represents each
individual member state being examined. Lastly,
'y' represents the cumulative fiscal pressure
being analyzed.
Vector
Error Correction Model (VECM) Approach
Further, the
present paper uses the VECM approach for
forecasting macroeconomic variables. The VECM is a
widely used econometric model that allows for the
analysis of long-run relationships and short-run
dynamics among multiple time series variables. By
incorporating both the cointegration and error
correction mechanism, the VECM provides a powerful
framework for modelling and forecasting
macroeconomic variables. In this study, we apply
the VECM methodology to a set of key macroeconomic
indicators and evaluate its forecasting
performance against alternative approaches. The
VECM analysis shows the results of short as well
as long-run impact, despite the stationarity
properties of the series. The specification of the
VECM model is as follows:
 (3)
(3)
The symbol of ‘Δ’ denotes first-difference order,
and  is an error correction term with no correlation
with the independent variables of the model. The
long-run relationship of the variables can be
achieved if b0,i= 0 is
negative and it is rejected in the model. On the
other hand, the short-term relationship among the
variables can be observed, if b 1,i =
0 is rejected, through the Wald test.
is an error correction term with no correlation
with the independent variables of the model. The
long-run relationship of the variables can be
achieved if b0,i= 0 is
negative and it is rejected in the model. On the
other hand, the short-term relationship among the
variables can be observed, if b 1,i =
0 is rejected, through the Wald test.
Discussion
Macroeconomic Policies and the
Public Health Expenditure: Indian States
The potential of a
rise in India's public health expenditures is
increased by the combination of improved growth
prospects at least over the medium term and fiscal
consolidation [8]. Since the 1990s there is
changing trends of macroeconomic factors such as
total social expenditure, per capita gross
domestic product (GDP) as a proxy of economic
growth, internal debt, fiscal deficit, central
grants to respective states, and revenue account
through total revenue receipts, states’ own and
non-tax revenue and public health expenditure
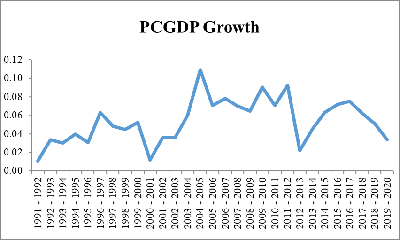
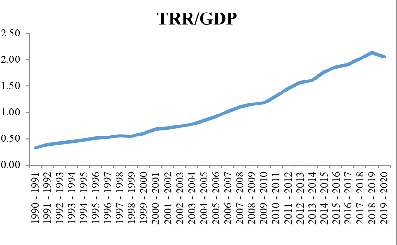
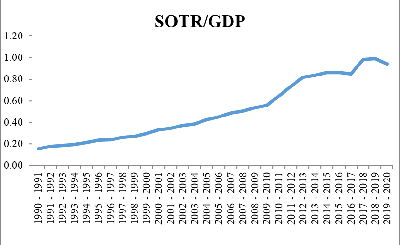
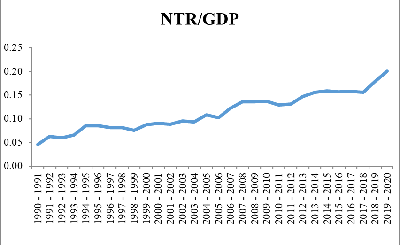
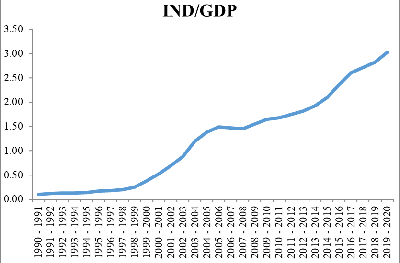
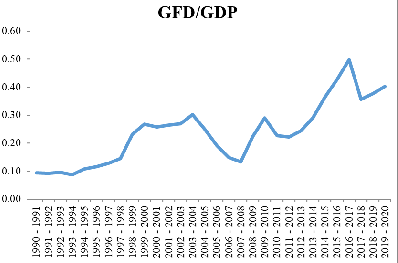
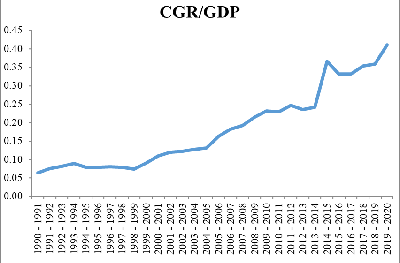
across the Indian states (Figure1).
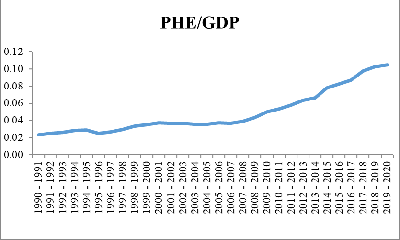
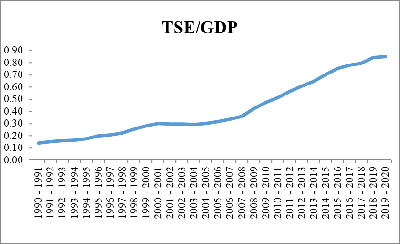
For the development of healthcare sector, the
macroeconomic factors play a vital role in the
contribution of fiscal space [9]. The growth trend
of PHE to GDP has consistently increased and it
increases from 0.2 in 1990-91 to 0.10 per cent in
2019-20. The trend of public health expenditure to
GDP is increased with total social sector
expenditure in the ratio of GDP. The increasing
trend of total revenue receipts and central grants
with increasing states’ own tax and non-tax
revenue has been observed over time, which can be
considered as the prospective source for financing
the healthcare system. A similar study has found
that Indian states being heterogeneous in nature
and having low tax revenue, there is a positive
impact of tax revenue on healthcare expenditure
growth over time [10].
|
|
|
|
|
|
|
|
|
Figure 1: Public Health
Expenditure and Macroeconomic Variables:
Trends Analysis
Source: Authors’ Calculation based on EPWRF
data series (1990-91 to 2019-20). |
However, with the
increasing trend of the PHE-GDP ratio, the fiscal
deficit and internal debt in ratio of GDP also
increased, it may be considered that the debt and
deficit amount is used in development expenditure
purpose like public health and education. Despite
of growth of revenue trend, the growth trend of
PHE is slightly declined during 2001-02 to 2004-05
due to higher fiscal deficit but it increased
after the reduction of fiscal deficit in 2007-08.
Further, there is fluctuation in terms of per
capita GDP of Indian states over time. Although, a
positive bi-directional relationship has been
found for developing countries. The effect of
health expenditures on economic growth justifies
the need for governments to implement policies
that encourage health expenditures to create a
healthier and more productive society in order to
foster the development and expansion of the
economy in developing nations [11].
Tendency
of Convergence: “σ” Analysis
As stated in the
methodology section, the assessment of
convergence/divergence through σ-convergence can
be carried out using the coefficient of variation
method. The results of the coefficient of
variation over time for all the northeastern
states together reveal that macroeconomic
variables, including states' own tax revenue,
internal debt, public health expenditure, and
total social sector expenditure, tend to converge
during the period of 2019-20. The variable of
fiscal deficit has exhibited greater fluctuations
compared to other variables. However, it is
noteworthy that fiscal deficit has displayed a
declining trend since the fiscal year 2016-17.
Additionally, it is observed that variables such
as per capita GSDP, non-tax revenue, and central
grants to states have shown a tendency to diverge
over time. Therefore, it is evident that the
northeastern states reveal a similar pattern in
terms of their performance in macroeconomic
factors, as they are all economically, socially,
and geographically underdeveloped.
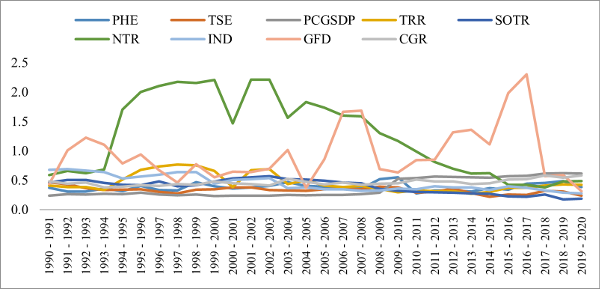
|
Figure 2: Sigma Convergence
Analysis from 1990-91 to 2019-20
Source: Authors’ Calculation based on EPWRF
data series (1990-91 to 2019-20). |
Macroeconomic
Factors Response to PHE from 1990-91 to
2019-20
Prior to the
empirical analysis of the model, the panel unit
root test has been applied for all the nine
variables of the study, by using Levin-Lin-Chu
“LLC”, [12] and Im-Pesaran-Shin “IPS” [13] test.
The LLC test is an extension of the Augmented
Dicky Fuller (ADF) test for panel data. It assumes
the presence of a common unit root across all
individuals, while the IPS test allows for both a
common unit root and individual-specific unit
roots, considering cross-sectional dependence and
heterogeneity. Afterwards, the long-term
co-movement between the variables has checked
through the Johansen cointegration test. The
Johansen cointegration test enables the analysts
to comprehend the interdependencies and dynamics
between various economic variables and to make
better decisions based on the discovered long-term
relationships. Based on the results of unit root
and cointegration test, further long-run and
short-run impact of the macroeconomic variables on
public health expenditure can be analyzed by
utilizing the VECM approach.
Panel
Unit-Root Tests
The result of panel
unit root tests is presented in Table 2,
where null shows non-stationarity and the
alternative hypothesis indicates stationarity in
the series. The variables, viz. public health
expenditure, total social sector expenditure, per
capita GSDP, states’ own tax revenue, internal
debt, and central grants to states are panel
non-stationary and total revenue receipts, states’
own non-tax revenue and fiscal deficit are
stationary at the level in LLC test. Further, in
case of the IPS test, except for states’ own
non-tax revenue and fiscal deficit, all the other
variables are panel non-stationary at level.
Besides, all the variables are stationary at first
difference level in case of both LLC and IPS
tests.
|
Table 2:
Results of Panel Unit Root Test
|
|
Trend &
Intercept
|
|
Variable(s)
|
LLC
|
IPS
|
|
I(0)
|
(1)
|
I(0)
|
(1)
|
|
PHE
|
-0.443
|
-11.716***
|
2.338
|
-11.978***
|
|
TSE
|
-0.334
|
-14.027***
|
1.035
|
-13.414***
|
|
PCGSDP
|
2.766
|
-9.056***
|
5.169
|
-10.518***
|
|
TRR
|
-1.697**
|
-10.861***
|
0.120
|
-11.255***
|
|
SOTR
|
4.419
|
-2.703***
|
9.496
|
-6.832***
|
|
NTR
|
-4.258***
|
-2.944***
|
-4.806***
|
-8.260***
|
|
IND
|
1.340
|
-6.242***
|
-0.477
|
-6.948***
|
|
GFD
|
-2.154***
|
-8.800***
|
-3.457***
|
-11.511***
|
|
CGR
|
0.643
|
-10.742***
|
-0.830
|
-13.585***
|
|
Source: Authors’
Calculation based on EPWRF data series
(1990-91 to 2019-20)
Note: ***, ** indicates significance level
of 1 & 5 per cent.
|
Panel Cointegration Tests
The significance of
cointegration test lies in its ability to
facilitate the establishment of a meaningful and
consistent association between variables, even in
the absence of direct causal linkage. Table 3
demonstrates the results of the Johansen
cointegration test [14], which indicates the
long-term relationships between PHE and other
macroeconomic variables (as eq.1). The
results of the test show that there is significant
long-run co-movement among public healthcare
expenditure and the macroeconomic variables such
as total social sector expenditure, per capita
GSDP, total revenue receipts, states’ own tax and
non-tax revenue, internal debt, fiscal deficit and
central grants to states, implying that the public
health expenditure would be sustained in the
long-run with increase or decrease in total social
sector expenditure, expansion of revenue
generation, lower fiscal deficit and internal debt
of the states.
|
Table 3: Results of Panel
Cointegration Tests
|
|
Null hypothesis (H0): No
cointgration
Alternative hypothesis (H1):
Presence of cointegration
|
|
Hypothesized No. of CE(s)
|
Trace Test
|
Max-Eigen Test
|
|
None
|
94.88***
|
574.4***
|
|
At most 1
|
595.3***
|
236.8***
|
|
At most 2
|
303.7***
|
213.5***
|
|
At most 3
|
314.4***
|
134.8***
|
|
At most 4
|
205.2***
|
108.0***
|
|
At most 5
|
120.8***
|
74.23***
|
|
At most 6
|
6026***
|
38.11***
|
|
At most 7
|
36.59***
|
34.08***
|
|
At most 8
|
20.69
|
20.69
|
|
Source: Authors’ Calculation based on
EPWRF data series (1990-91 to 2019-20)
Note: *** indicates significance level of
1 per cent.
|
Macroeconomic
Factors on Public Health Expenditure Growth:
Long-run Impact
This section
summarizes the key findings of the study and
emphasizes the value of the VECM approach in
forecasting macroeconomic variables. We highlight
its advantages over traditional models and its
potential to capture both short-run dynamics and
long-run equilibrium relationships. The long-run
impact of macroeconomic factors on public health
expenditure growth is presented in Table 4. The
coefficient of total social sector expenditure is
positive and significant at one per cent level,
indicating that an increase in TSE leads to 5 per
cent increase in PHE. Surprisingly, the per capita
GSDP is negative with -1.49 points at one per cent
significant level. A similar study found that the
northeastern states namely, Nagaland, Manipur and
Meghalaya exhibit a regressive trend in the change
of public healthcare financing. This is attributed
to the moderate increase in the states' domestic
product, which is accompanied by a decline in
government health expenditure [15]. Further, total
revenue receipts and states’ own tax revenue are
positively significant, implying an increase in
both the indicators leads to 3.8 and 11.9 per cent
increase in PHE, respectively. The coefficients of
states’ own non-tax revenue and central grants to
states have negative and significant impact on the
growth of PHE in the long run. Although, all the
eight northeastern states are getting higher
central grants, being in the list of Special
Category States, due to various disadvantageous
features [16]. The northeastern states might fail
to increase healthcare expenditure due to their
lack of physical and social infrastructure
facilities. Besides, the coefficient of internal
debt is negative, while the fiscal deficit has
positive impact on PHE at ten per cent level.
Thus, it is clear that an increase in total social
sector expenditure and revenue receipts have
favourable impact on the growth of PHE for the
North Eastern states in the long run.
|
Table 4:
Results Panel VECM Tests: Long-run
Impact
|
|
Dependent = PHE
|
|
Variable(s)
|
Coeff.
|
Std. Error
|
T-stat
|
Prob.
|
|
TSE
|
0.050***
|
0.014
|
3.391
|
0.0008
|
|
PCGSDP
|
-1.492***
|
5.663
|
-2.635
|
0.0090
|
|
TRR
|
0.038***
|
0.004
|
9.139
|
0.0000
|
|
SOTR
|
0.119***
|
0.019
|
6.193
|
0.0000
|
|
NTR
|
-0.042***
|
0.004
|
-8.668
|
0.0000
|
|
IND
|
-0.014***
|
0.003
|
-4.120
|
0.0001
|
|
GFD
|
0.012*
|
0.008
|
1.724
|
0.0861
|
|
CGR
|
-4.010***
|
1.041
|
-3.850
|
0.0002
|
|
Source: Authors’
Calculation based on EPWRF data series
(1990-91 to 2019-20)
Note: ***, * indicates significance level
of 1 & 10 per cent.
|
Macroeconomic
Factors on Public Health Expenditure Growth:
Short-run Impact
Due to lack of
resources and lack of proper utilization of the
existing resources, low-income category states of
India were lagging behind in public sector
efficiency [17]. The short-run impact of
macroeconomic variables on PHE has been analysed
through the VECM approach. Table 5 explains that
the model that has short-run impact and the error
correction term value is -0.052 at one per cent
significant level. The coefficients of total
social sector expenditure and states’ own tax
revenue have positive short run impacts on the
growth of public health expenditure. Additionally,
PHE has been negatively affected, through central
grants. Further, fiscal deficit has negatively and
significant effect on PHE in the short-run. The
other variables such as total revenue receipts,
per capita GSDP, states’ own non-tax revenue and
internal debt have no short-run impact on PHE.
Thus, it is clear that an increase in total social
sector expenditure and revenue receipts also has
favourable impact on the growth of PHE for the
northeastern states in the short run.
|
Table 5:
Results Panel VECM Tests: Short-run
Impact
|
|
Dependent = PHE
|
|
Variable(s)
|
Coeff.
|
Std. Error
|
T-stat
|
Prob.
|
|
TSE
|
0.064**
|
0.028
|
2.222
|
0.026
|
|
TSEt_1
|
0.082***
|
0.030
|
2.697
|
0.007
|
|
PCGSDP
|
-2.328
|
3.965
|
-0.587
|
0.557
|
|
PGSDP_1
|
-6.438
|
3.949
|
-1.629
|
0.103
|
|
TRR
|
-0.001
|
0.008
|
-0.193
|
0.846
|
|
TRR_1
|
-0.002
|
0.009
|
-0.234
|
0.814
|
|
SOTR
|
0.083***
|
0.033
|
2.511
|
0.012
|
|
SOTR_1
|
0.112***
|
0.043
|
-2.607
|
0.009
|
|
NTR
|
0.004
|
0.010
|
0.049
|
0.960
|
|
NTR_1
|
0.001
|
0.010
|
0.127
|
0.898
|
|
IND
|
-0.003
|
0.009
|
-0.308
|
0.757
|
|
IND_1
|
-0.003
|
0.009
|
-0.032
|
0.973
|
|
GFD
|
-0.007
|
0.009
|
-0.777
|
0.436
|
|
GFD_1
|
-0.007***
|
0.009
|
-2.606
|
0.009
|
|
CGR
|
-8.128***
|
3.125
|
-2.600
|
0.009
|
|
CGR_1
|
-6.900***
|
2.959
|
-2.331
|
0.019
|
|
ECMt-1
|
-0.052***
|
0.013
|
3.973
|
0.001
|
|
Source: Authors’
Calculation based on EPWRF data series
(1990-91 to 2019-20)
Note: ***, ** indicates significance level
of 1 & 5 per cent.
|
Conclusion
The relationship
between macroeconomic factors and healthcare
expenditure can be complex and can vary across
countries depending on their healthcare systems,
policies, and socio-economic factors, which need
to carefully balance these factors to ensure
sustainable and equitable healthcare spending. The
present study examines the impact of macroeconomic
factors i.e. economic growth, revenue account,
internal debt, fiscal deficit, and central grants
on the public health expenditure in evaluating
financial space for health in the northeastern
states of India from 1990-91 to 2019-20. The study
observed that the trend of public health
expenditure to GDP is increased with total social
sector expenditure, total revenue receipts and
central grants with increasing states’ own tax and
non-tax revenue in ratio of GDP, which can be
considered as the prospective source for financing
healthcare system of Indian states. Besides, the
macroeconomic factors of the northeastern states,
such as states' own tax revenue, internal debt,
public health expenditure, and total social sector
expenditure tend to converge during 2019-20.
Fiscal deficit fluctuates more than other
indicators but tends to converge since 2015-16.
Further, per capita GSDP, non-tax revenue, and
central transfers to states are diverging over
time. The study results based on the VECM approach
highlight that with the increase in total social
sector expenditure and all the revenue receipts
heads viz. total receipts and states’ own and
non-tax revenue have favourable impact on the
growth of PHE for the northeastern states in both
long-run and short-run. The central grants to the
northeastern states have both short-run and
long-run impacts on PHE. Thus, it can be said that
being key indicators of economic development, the
macroeconomic factors lead to a significant impact
on healthcare expenditure. The variables like
fiscal deficit and internal debt have no short-run
impact but they have long-run significant impact
on the growth of healthcare expenditure. Thus, the
findings of the study suggest that the government
of northeast India should develop such schemes for
healthcare development with higher infrastructure
facilities, including hospitals, clinics, and
healthcare training institutes. Increased
investment in infrastructure can contribute to
higher healthcare expenditure.
References
- Apergis N, Padhi P. Health expenses and
economic growth: convergence dynamics across the
Indian States. International Journal of
Health Care Finance and Economics. 2013
Dec;13:261-77.
- Neog N, Baruah M, Biswas K, Hazarika H.
An Inter District Analysis of Public Healthcare
Infrastructure Disparities in Assam. Online
Journal of Health Allied Sciences.
2023;22(1):1.
- Ray M, Sarangi M. Causal linkage between
social sector expenditure and economic growth:
Evidence from India. Indian Journal of
Economics and Business. 2021
Jul;20(2):463-73.
- Murugan K, Sivagnanam KJ. Public Expenditure
and Economic Development of Indian States: A
Panel Data Analysis. Journal of Economic
Policy and Research. 2019 Apr
1;14(2):69-79.
- Dwivedi R, Pradhan J. Does equity in
healthcare spending exist among Indian states?
Explaining regional variations from national
sample survey data. International Journal
for Equity in Health. 2017 Dec;16:1-2.
- Dash SK, Mohanty AR. The impact of income on
public health and education expenditure:
Evidence from the Indian states. Journal of
Public Affairs. 2022 Dec;22:e2757.
- Varkey RS, Joy J, Panda PK. Health
infrastructure, health outcome and economic
growth: evidence from Indian major states.
Health. 2020;7(11):2020.
- Misra BS, Panda AK. Public Expenditure on
Health and Health Outcomes: The Experience of
the Indian States. ILAKSHAN. 2007:43.
- Behera DK, Dash U. The impact of macroeconomic
policies on the growth of public health
expenditure: An empirical assessment from the
Indian states. Cogent Economics &
Finance. 2018 Jan 1;6(1):1435443.
- Behera DK, Dash U. Impact of GDP and tax
revenue on health care financing: An empirical
investigation from Indian states. Theoretical
& Applied Economics.
2017;2(611):249-66.
- Halıcı-Tülüce NS, Doğan İ, Dumrul C. Is income
relevant for health expenditure and economic
growth nexus? International Journal of
Health Economics and Management. 2016
Mar;16:23-49.
- Levin A, Lin CF, Chu CS. Unit root tests in
panel data: asymptotic and finite-sample
properties. Journal of Econometrics. 2002
May 1;108(1):1-24.
- Im KS, Pesaran MH, Shin Y. Testing for unit
roots in heterogeneous panels. Journal of
Econometrics. 2003 Jul 1;115(1):53-74.
- Johansen S. Estimation and hypothesis testing
of cointegration vectors in Gaussian vector
autoregressive models. Econometrica: Journal
of the Econometric Society. 1991 Nov
1:1551-80.
- Behera DK, Dash U. Effects of economic growth
towards government health financing of Indian
states: an assessment from a fiscal space
perspective. Journal of Asian Public Policy.
2019 May 4;12(2):206-27.
- Saikia B, Roy CS, Shah S. FRBM Act and Fiscal
Performance of the Special Category States of
India: A Trend Analysis. Social Change and
Development. 2022:1-17.
- Mohanty RK, Bhanumurthy NR. Assessing public
expenditure efficiency at Indian states.
National Institute of Public Finance and Policy,
New Delhi, NIPFP Working Paper. 2018 Mar 19;225.
|


