|
Introduction
It is
reported that 55% of the deaths of children below
five years of age are due to malnutrition (1).
India has the highest occurrence of childhood
malnutrition in the world (2). The assessment of
growth is essential during preschool age, more
particularly in pediatric neurological
examination, measurement of the head circumference
plays a vital role. Very important information can
be suggested from the head size and shape that
will guide the differential diagnosis and the need
for further investigations. Head circumference
(HC) is a simple and non-invasive anthropometric
measure. Also known as the frontal occipital
circumference, HC has been cautiously used to
assess the frequencies of undernutrition among
preschool children (3). This circumference is an
index of cranial growth and is also considered to
be an index of once nutritional status and
development of the brain and brain size (4,5).
Growth assessment best defines the health and
nutritional status of children, because
disturbances in health and nutrition, anyhow of
their aetiology, always affect child growth and
hence give an indirect measurement of the quality
of life of an entire population (6). Anthropometry
plays a significant part in the evaluation of
nutritional status among preschool children.
Several anthropometric measurements have been
suggested for studies on growth and nutritional
status, but height, weight, mid-upper arm
circumference, head circumference (HC), and skin
fold thickness are most frequently used. Regular
monitoring of head circumference is an essential
component of nutritional assessment in children up
to age three and longer in children who are at
high nutritional risk (7). Undernutrition produces
notable morphological changes in brain size
development which may damage intellectual
potentiality and can limit productivity in
preschool children (8). Head Circumference is a
good indicator for marginal cases of
protein-energy malnutrition in both survey and
screening programs (9). Head circumference (HC) is
a physical index of both past and present
nutrition and brain development (10). In the field
of pediatrics, it is a routine measurement to
assess brain development, though micro and
macrocephaly are considered dependable indicators
of brain pathology (11). It has been defined as
the most sensitive anthropometric indicator of
undernutrition during infancy, associated with
intellectual impairment (12,13). Poor attainment
of physical growth of the brain affects cognitive
capacities (14-16).
HC is an especially
useful indicator that should be measured more
frequently (17-19). Veritably many published data
are available on growth patterns and prevalence of
undernutrition among preschool children using HC.
Most of the earlier studies had published data on
HC along with growth increments in children
(20-23). Several research investigations have
reported the physical growth pattern and magnitude
of undernutrition (low HC-for-age; <-2SD) among
preschool children in India (7,9,18,24-28).
The present
research work attempted to study age and sex
variation of Head circumference and assessment of
the nutritional condition among rural preschool
children of Maynaguri, Jalpaiguri, West Bengal,
India, by using WHO (2007) recommended cut-off
points for head circumference for age. We try to
assess the nutritional status of studied preschool
children by using Head Circumference as an
indicator.
Materials and Methods
Cross-sectional
study has been conducted to determine age and
sex-specific prevalence of undernutrition by using
HC among rural preschool children of Jalpaiguri,
India. It also focuses on the implicit part of HC
in assessing nutritional status among rural
preschool children. The present cross-sectional
study was carried out among preschool children
aged 24-60 months under the Integrated Child
Development Scheme (ICDS) located in the rural
areas of Maynaguri block of Jalpaiguri district.
Jalpaiguri is situated at the northern region of
West Bengal. Jalpaiguri is located 26° 16’ &
27° 0’ North latitude and 88° 4‘& 89° 53‘East
longitude. According to the Census of India 2011
(29), 51.47 % live in urban areas and 48.9 % live
in rural areas. A total of 782 preschool children
(boys= 384, girls = 398) aged 24-60 months were
studied. Information about the non-anthropometric
variables such as age and sex, was collected by
pre-structured interview schedule. All children
come from rural backgrounds.
Ethical
consideration was guided by Helsinki Declaration
(30). Ethical approval and prior permission were
obtained from the University of North Bengal. The
measurement (head circumference in cm.) was taken
following the standard method by Lohman et al.
1988 (31). Nutritional status of the children was
evaluated using the following criteria, Moderate
undernutrition < - 2 SD, Severe undernutrition
< - 3 SD where SD refers to the age and
sex-specific WHO standard deviations of Head
circumference. Statistical analysis done on SPSS
version 18. Age and sex specific differences were
done by t Test, and ANOVA test at the level
p<0.05. WHO anthro software was used to assess
the nutritional status.
After an extensive
literature review, no result has been found from
the study area of Maynaguri. Hence, the present
study aims to analyse age and sex variation of
Head circumference among studied children and also
observe the prevalence of undernutrition by the
Head circumference cut-off (WHO 2007) among
preschool children of Maynaguri.
Results
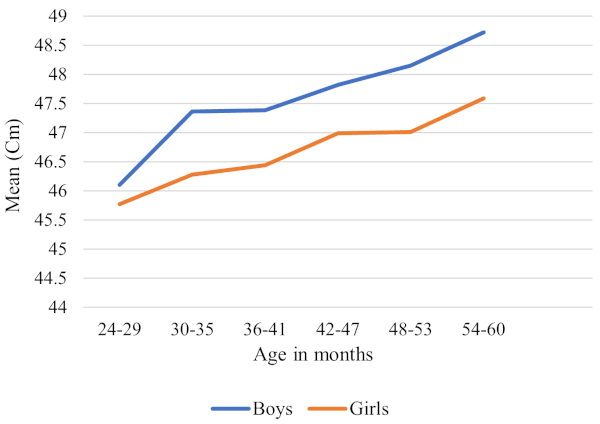
Table 1 describes
sex differences in head circumference by age. The
mean ± SD HC of boys was higher (47.68 ± 1.63)
than the girls (46.78 ± 1.58). There were
statistically significant mean differences in HC
of boys and girls (t= 7.856, p< .001). The mean
value of HC increased with the advancement of age.
Highly significant sex differences in mean HC were
observed at all age groups, 30-35 months (t= 4196
p< .001), 36-41 months (t= 3.333 p<.001),
42-47 months (t = 3.224 p< .01), 48-53 months
(t = 4.869 p< .001), 54-60 months (t = 4.862
p< .001) except 24-29 months. Significant age
variations in mean HC were found among both sexes
(boys: F = 24.367, p< .001, Girls: F = 12.86,
p< .001). Fig 1 shows the age specific sexual
dimorphism of the mean Head circumference of the
studied population.
|
Table 1: Age and sex wise Mean (SD) for
Head Circumference
|
|
Age in months
|
Head Circumference
|
t
|
Sex Combined
|
|
Boys
|
Girls
|
|
24-29(N= 105)
|
46.10 (1.40)
|
45.77 (1.38)
|
1.217 NS
|
45.94 (1.40)
|
|
30-35(N=121)
|
47.36 (1.48)
|
46.28 (1.32)
|
4.196***
|
46.86 (1.50)
|
|
36-41 (N=130)
|
47.38 (1.36)
|
46.44 (1.80)
|
3.333***
|
46.92 (1.65)
|
|
42-47 (N=121)
|
47.82 (1.32)
|
46.99 (1.46)
|
3.224**
|
47.38 (1.45)
|
|
48-53 (N=131)
|
48.15 (1.25)
|
47.01 (1.39)
|
4.859***
|
47.51 (1.44)
|
|
54-60 (N=174)
|
48.72 (1.61)
|
47.59 (1.46)
|
4.862***
|
48.15 (1.63)
|
|
24-60(N= 782)
|
47.68 (1.63)
|
46.78 (1.58)
|
7.856***
|
47.22 (1.67)
|
|
F value
|
24.367***
|
12.86***
|
|
|
*p<0.05, **p<0.01, ***p<0.001
|
|
| Figure
1: Sexual dimorphism of the Head
Circumference of the studied children
|
Table 2 describes
the age and sex specific mean and SD of HC for Z
score. The mean HC for Z score is lower among boys
-1.45 (±.99) than girls -1.49 (±1.05). The lowest
value of HC for Z score was seen among boys in the
age group of 24-29 months on the other hand lowest
value of HC for Z score was observed in the age
group of 48-53 months among girls. Statistically
significant sex difference in mean HC for Z score
found at the age group of 24-29 months.
|
Table 2: Age and sex wise Mean (SD) for
Head Circumference for Z score
|
|
Age in months
|
Boys (N)
|
HC for Z score
|
Girls (N)
|
HC for Z score
|
t Test
|
|
24-29
|
52
|
-1.75 (1.00)
|
53
|
-1.19 (.99)
|
-2.860*
|
|
30-35
|
65
|
-1.27 (1.04)
|
56
|
-1.33 (.94)
|
.325 NS
|
|
36-41
|
67
|
-1.57 (.97)
|
63
|
-1.56 (1.26)
|
-.032 NS
|
|
42-47
|
57
|
-1.50 (.90)
|
64
|
-1.49 (1.02)
|
-.050 NS
|
|
48-53
|
57
|
-1.48 (.84)
|
74
|
-1.71 (.98)
|
1.395 NS
|
|
54-60
|
86
|
-1.26 (1.08)
|
88
|
-1.53 (1.03)
|
1.671 NS
|
|
24-60
|
384
|
-1.45 (.99)
|
398
|
-1.49 (1.05)
|
.512 NS
|
|
*P<0.01, NS= Not significant
|
Table 3 describes
age and sex specific prevalence of undernutrition.
Age combined rates of moderate undernutrition for
boys was 21.87 % and for girls was 25.37 %.
Age-combined severe undernutrition among boys and
girls were 5.72% and 6.53 %, respectively. The
highest number of moderate undernutrition was
found in the age group of 42-47 months (33.33%)
among boys, and in the case of girls in the age
group of 48-53 months (39.18 %). The highest
number of severe undernutrition was seen at 24-29
months (13.46 %) among boys and at 42-47 months
(9.38 %) among girls.
|
Table 3: Age and sex-specific frequency
(%) distribution for undernourished
children based on Head Circumference for Z
score
|
|
Age in months
|
Boys
|
Girls
|
|
(-3 to <-2 Z score) Moderate
|
(< -3 Z score) Severe
|
(<-2 Z score) Total
|
(-3 to <-2 Z score) Moderate
|
(< -3 Z score) Severe
|
(<-2 Z score) Total
|
|
24-29
|
8(15.38)
|
7(13.46)
|
15(28.85)
|
7 (13.21)
|
3 (5.66)
|
10 (18.87)
|
|
30-35
|
12(18.46)
|
3(4.61)
|
15 (23.08)
|
9 (13.84)
|
2 (3.07)
|
11 (19.64)
|
|
36-41
|
14(20.89)
|
6(8.95)
|
20 (29.86)
|
19 (30.16)
|
5 (7.94)
|
24 (38.10)
|
|
42-47
|
19(33.33)
|
2(3.5)
|
21 (36.85)
|
14 (21.87)
|
6 (9.38)
|
20 (21.25)
|
|
48-53
|
15(26.31)
|
1(1.75)
|
16 (28.08)
|
29 (39.18)
|
4 (5.40)
|
33 (44.60)
|
|
54-60
|
16(18.60)
|
3(3.48)
|
19 (22.1)
|
23 (26.13)
|
6 (6.82)
|
29 (32.95)
|
|
Overall
|
84(21.87)
|
22(5.72)
|
106(27.60)
|
101(25.37)
|
26 (6.53)
|
127(31.91)
|
|
(χ2) for boys (16.609, p>0.05), (χ2)for
girls (18.096, p >0.05)
|
Discussion
Studies were done
by various researchers to find out the prevalence
of undernutrition by Head Circumference for Z
score. The highest amount of malnourished
preschool children is seen among rural preschool
children of Hooghly district (boys 64.9 % and
girls 62.8 %) (18). Whereas the lowest prevalence
of malnourished children was seen among Bengalee
preschool children of Midnapore, West Bengal
(boys: 19.2%, Girls: 22.6%) (24). Current study
reveals that a higher percentage of malnourished
boys observed from the previous study on Midnapore
(24) and slightly lower than children of 24
Pargana (26). A higher percentage of malnourished
girls was seen than in the previous study done on
Bangalkot and Midnapore (7,24). Several research
reported sexual dimorphism in HC among preschool
children, age and sex-specific mean HC were
significantly (p<0.05) higher among boys than
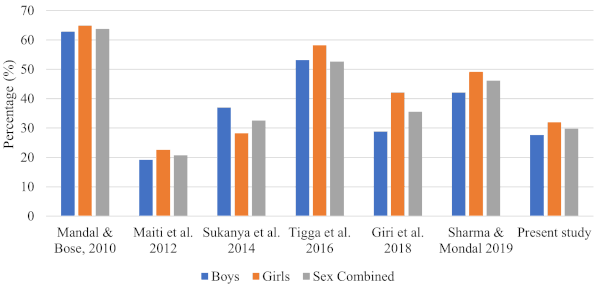
girls (18,25,31,32). The overall prevalence of
undernutrition using the HC among girls (31.91 %)
seems to be higher than that in the case of boys
(27.6 %). The prevalence of undernutrition
according to head Circumference was higher among
girls than boys in the present study similar to
previous studies (18,24-27). Fig 2 shows Head
Circumference based undernutrition with previous
studies.
|
Table 4: Comparison of prevalence of
undernutrition by using HC for Z score
with previous studies
|
|
Study Area
|
Sample size
|
Boys
|
Girls
|
Sex Combined
|
Reference
|
|
Hooghly, West Bengal
|
894
|
62.80
|
64.90
|
63.80
|
Mandal & Bose, 2010
|
|
Midnapore, West Bengal
|
1060
|
19.20
|
22.60
|
20.75
|
Maiti et al. 2012
|
|
Bangalkot, Karnataka
|
166
|
37.03
|
28.23
|
32.53
|
Sukanya et al. 2014
|
|
Darjeeling, West Bengal
|
477
|
53.16
|
58.16
|
52.62
|
Tigga et al. 2016
|
|
24 Pargana, West Bengal
|
656
|
28.84
|
42.12
|
35.52
|
Giri et al. 2018
|
|
Karbi Anglong, Assam
|
490
|
42.18
|
49.10
|
46.12
|
Sharma & Mondal 2019
|
|
Jalpaiguri, West Bengal
|
782
|
27.60
|
31.91
|
29.8
|
Present Study
|
|
| Figure
2: Comparison of Head Circumference based
undernutrition with previous studies.
|
Several studies have
recommended that age and sex specific
population-wise references be developed to assess
the physical growth and nutritional status among
preschool children by using HC as an indicator
(33-39). Studies reported that gender differences
in the prevalence of undernutrition were more
pronounced in poor socio-economic groups and lower
segments of the tribal populations with girls
being more undernourished than boys (24,25,40).
Age-specific prevalence of undernutrition is
higher between 42-60 months similar to the
previous study (7,24,25). In the present study the
form of moderate malnutrition is higher than
severe malnutrition, many other studies conducted
by researchers (7,18,25) supported the same type
of results. Head circumference is considered as
most important anthropometric measurement during
infancy and early childhood (41). Head
circumference is a non-invasive and inexpensive
anthropometric indicator of both nutritional
background and brain development (42). It has been
widely recognized as the most sensitive
anthropometric index of prolonged undernutrition
during infancy, associated with intellectual
impairment and especially IQ (43). In the present
study, we observed that the mean HC for girls is
46.78 cm (1.58) lower than the mean HC of boys
47.68 cm (1.63) similar study reported by other
researchers (7, 18, 24-27).
Conclusion
The present study
observed the prevalence of undernutrition found to
be a persistent health problem among preschool
children of Jalpaiguri. The frequency of moderate
undernutrition was higher than severe
undernutrition in the study. Girls were more
affected by moderate and severe undernutrition
compared to boys. Prevalence of undernutrition
during preschool age is also a cause of impaired
development of brain volume and size and a result
of reducing cognitive and intellectual
potentiality of future life. Head circumference is
a non-invasive technique that may be utilized to
assess nutritional conditions among pre-schoolers
as a routine practice. Head Circumference is an
indicator of brain development so initiative
should be taken to improve the nutritional
condition of rural preschool children. Therefore,
regular monitoring of growth patterns and volume
of head circumference during preschool age is
essential to detect neurological undernourishment.
Acknowledgement
The researchers
would like to thank all the concerned ICDS workers
and also the parents of the subjects for their
cooperation. We thank those children who
participated in this research work. Special thanks
to the CDPO of Maynaguri for his support. However,
the authors assume full responsibility for all
data and content presented. Arindam Biswas is a
recipient of a Senior Research Fellowship
(SRF-UGC-NET) by the Government of India.
References
- UNICEF. The Progress of Nations. UNICEF, New
York; 1994.
- Bamji, MS. Early nutrition and health –
Indian perspective. Current Science.
2003;l85:1137–114
- WHO Multicentre Growth Reference Study Group.
WHO Child Growth Standards: Head circumference
for age, arm circumference for age, triceps
skinfold for age and subscapular skinfold for
age: Methods and development. Geneva: World
Health Organization, 2007;1-237.
Available at https://iris.who.int/bitstream/handle/10665/43706/9789241547185_eng.pdf
- Plaza LB, Brito IN, Torrejón PH, et al. The
impact of malnutrition on brain development,
intelligence and school work performance.
Arch Latinoam Nutr. 2001;51:64-71.
- Ivanovic DM, Leiva BP, Pérez HT, et al. Head
size and intelligence, learning, nutritional
status and brain development. Head, IQ,
learning, nutrition and brain.
Neuropsychologia. 2004;42:1118-31
- de Onís, M, Monteiro C, Akré J, et al. The
worldwide magnitude of protein energy
malnutrition, an overview from the WHO global
database on child growth. Bulletin of WHO.
1993;71:703-712.
- Sukanya BV, Baragundi MC, Surekharani CS, et
al. Assessment of nutritional status of
preschool children using head circumference.
International Journal of Current Medical and
Applied Sciences. 2014;4:72-75
- Cornelio-Nieto JO, The effect of PEM on the
central nervous system in children. Rev
Neurol. 2007;44(2):S571-S574.
- Singh S, Bisnoi I. Trend of growth in mid-arm
circumference and head circumference of
preschool female children of Faizabad District,
U.P. Indian Journal of Preventive &
Social Medicine. 2005;36(3 &
4):143-146.
- Rumsey JM, Rapoport JL. Assessing behavioral
and cognitive effects of diet in pediatric
populations [Wurtman RJ, Wurtman JJ, editors].
New York, NY: Raven Press. 1983;101–161
- Menkes JH, Baltimore. Textbook of Child
Neurology, United Kingdom: Williams &
Wilkins. 1995.
- Stoch MB, Smythe PM, Moodie AD, et al.
Psychosocial outcome and CT findings after gross
undernourishment during infancy: a 20-year
developmental study. Developmental Medicine
and Child Neurology. 1982;24:419–436.
- Winick M, Rosso P. Head circumference and
cellular growth of the brain in normal and
marasmic children. Journal of Pediatrics.
1969;774-778.
- Gale CR, O’Callaghan FJ, Godfrey KM, et al.
Critical periods of brain growth and cognitive
function in children. Brain.
2004;127(2):321-329.
- Lee KS, Cheong HK, Eom JS, et al. Cognitive
decline is associated with nutritional risk in
subjects with small head circumference (HC).
Arch Gerontol Geriatr,
2010;51(1):105-109.
- Talebian A, Soltani B, Moravveji A, et al. A
study on causes and types of abnormal increase
in infants’ head circumference in Kashan/Iran.
Iran J Child Neurol. 2013;7(3):28-33.
- Savage SA, Reilly JJ, Edwards CA, et al.
Adequacy of standards for assessment of growth
and nutritional status in infancy and early
childhood. Archives of Disease in Childhood.
1999;80:121-124.
- Mandal GC. & Bose K. Undernutrition among
the rural preschool children (ICDS) of Arambag,
Hooghly District, West Bengal, India, using new
head circumference cut-off points.
International Journal of Current Research.
2010;10:007-011
- Tiwari K, Goyal S, Malvia S, et al. Impact of
malnutrition on head size and development
quotient. International Journal of
Research in Medical Science.
2017;5(7):3003-3006
- Purohit M, Purohit NN, Saxena SS. Physical
Growth of Indian Infants from Birth to Six
months. (A Longitudinal Study). Ind J of
Pediatr. 1977;44:289- 90.
- Bhandari A, Ghosh, BN. A longitudinal study
on physical development of the children from
birth to one year of age in an urban community.
Ind J Pub Health. 1979;23:147–54.
- Bhargava SK, Kumari S, Choudhury P, et al. A
Longitudinal Study of Physical Growth from Birth
to Six Years in Children with Birth Weight of
2501g or More. Ind Pediatr.
1980;17:495-502.
- Bhalla AK, Walia, BNS. Longitudinal growth of
head circumference in Punjabi infants in
Chandigarh (India). Int J Anthropol.
1993;8:123-31.
- Maiti S, Ali KM, Ghosh D, et al. Assessment
of head circumference among pre-school children
of Midnapore town, west Bengal using WHO (2007)
recommended cut-off points. Int J Prev Med.
2012;3(10):742-744
- Tigga PL, Mondal N, Sen J. Head circumference
as an indicator of undernutrition among tribal
preschool children aged 2-5 years of North
Bengal, India. Hum Biol Rev.
2016;5(1):17-33.
- Giri SP, Biswas S, Bose K. Head circumference
based nutritional status of rural Bengalee
preschool children from Sagar Island, West
Bengal, India. Mankind Quarterly.
2018;58(4):599-610.
- Sharma J, Mondal N, Assessment of
Undernutrition using Head Circumference-for-Age
among Karbi Preschool Children of Karbi Anglong,
Assam, India. J Life Science. 2019;
11(1-2): 7-16 DOI:
10.31901/24566306.2019/11.1-2.238
- Singh I, Grover K. Nutritional profile of
urban pre-school children of Punjab. Anthropologist
2003;5(3):149-153.
- Govt. of India. Census 2011. Available at
https://censusindia.gov.in
- Goodyear MDE, Krleza-Jeric K, Lumment T. The
Declaration of Helsinki. BMJ.
2007;335:624-625.
- Lohman, TG, Roche AF, Martorell R.
Anthropometric Standardization Reference Manual,
Human Kinetics Books, Chicago; 1988.
- Oyedeji GA, Olamijulo SK, Osinaike AI, et al.
Head circumference of rural Nigerian
children-the effect of malnutrition on brain
growth. Cent Afr J Med.
1997;43(9):264-268.
- Zaki ME, Hassan NE, El-Masry SA. Head
circumference reference data for Egyptian
children and adolescents. East Mediterr
Health J. 2008;14(1):69-81.
- Júlíusson PB, Roelants M, Nordal E, et al.
Growth references for 0-19 year-old Norwegian
children for length/ height, weight, body mass
index and head circumference. Ann Hum Biol.
2013;40(3):220-2
- Rollins JD, Collins JS, Holden KR. United
States head circumference growth reference
charts: Birth to 21 years. J Padiatr.
2010;156(6):907-913
- Elmali F, Altunay C, Mazicioglu MM, et al.
Head circumference growth reference charts for
Turkish children aged 0- 84 months.
Pediatr Neurol. 2012;46(5):307-311.
- Xie S, Shi J, Wang J, et al. Head
circumference growth reference charts of
children younger than 7 years in Chinese rural
areas. Pediatr Neurol.
2014;51(6):814-819
- Neyzi O, Bundak R, Gökçay G, et al. Reference
values for weight, height, head circumference,
and body mass index in Turkish children. J
Clin Res Pediatr Endocrinol.
2015;7(4):280-293
- Amare EB, Idsøe M, Wiksnes M, et al.
Reference ranges for head circumference in
Ethiopian children 0-2 years of age. World
Neurosurg. 2015;84(6):1566-1571
- Sen J, Mondal, N. Socio-economic and
demographic factors affecting the Composite
Index of Anthropometric Failure (CIAF). Ann
Hum Biol. 2012;(39):129-36.
- Hall JG, Allanson JE, Gripp KW, et al.
Handbook of Physical Measurements. New York:
Oxford University Press. 2007.
- Vernon PA, Wickett JC, Bazana PG, et al. The
neuropsychology and psychophysiology of human
intelligence. In Sternberg RJ (Ed.), Handbook of
intelligence. Cambridge: Cambridge University
Press. 2000;245-264
- Inzunza LB, Castro NPH, Jansana VJM, et al.
Algunas consideraciones sobre el impacto de la
desnutrición en el desarrollo cerebral,
inteligencia y rendimiento escolar. Archivos
Latinoamericanos de Nutrición.
2001;51:64-71.
|


