|
Introduction
The
study of inequality is an important subject in
developing countries. The issue has different
dimensions namely income inequality, wage
inequality, wealth inequality, education
inequality, inequality in opportunities etc. Each
inequality has different characteristics and
causes to study in-depth manner. The existence of
economic inequality is unfavourable to poor
people. For example, the existence of lower-income
of poor people due to inequality affects their
children’s educational attainment (1). Educational
inequality is a challenging question in the modern
developing world. The educational institutions are
the gatekeeper of a system through which students
make themselves eligible for better income
opportunities. The institution provides equal
opportunities to all the students to develop their
intellectual power to engage in society. The
person with a high educational level may have
high-income opportunities in society (2). The
expansion of education may lead to the reduction
of educational inequality. The expansion of
education reduces the educational inequality in
Taiwan. The development of education improves the
formation of human capital in the country. It
increased the well-being of the people in Taiwan
(3).
The evolution of
education leads to improvement of educational
enrolment rate as well as years of schooling
completed. However, the evolution from a low level
of education to a higher level increases the
international educational inequality. But such
inequality declined during the later period (4).
Again, one of the study observed the declining
pattern of socio-economic inequalities in
educational achievement as the level of education
increased for the population of Canada (5).
Similarly, the development of education is very
important for developing countries like India.
Since independence, access to education is one of
the primary factors of inequality and economic
development in India. The distribution of
education leads to regional imbalances in the
country. A person who possesses a higher level of
education results in an access to a job in the
modern sector (6). However, there is a strong
relationship between parental education and the
educational results of their children in the
twentieth century (7). There have some other
factors such as state policies, socio-economic
status of the family which determine the
educational attainment of the children in the
country especially in developing countries (8).
The development of
an economy is significantly related to educational
development. The higher amount of investment in
educational resources leads to the accumulation of
human capital. It improves the educational
attainment or average years of schooling in the
country. The development positively influences
economic growth. A study on the economy of Taiwan
supported such an aspect (9). Therefore, education
is a powerful instrument of the economic drive.
However, some of the research found the opposite
relationship between human capital formation and
economic growth (10, 11). Again, the relationship
between educational inequality and average years
of educational level may differ in different
countries. The relationship between the variables
may show curvilinear types relation (12). The
unequal distribution of education across the
gender is harmful to economic growth. It directly
hampers economic growth by decreasing the average
level of human capital in developing countries. It
indirectly hampers economic growth through
population growth (13).
One study
investigated the impact of gender inequality in
education on income. The study observed that a low
degree of female-male enrolment ratio
significantly correlated with the lower per capita
GDP, in addition to the influence of female
education on the per capita GDP (14). Again, one
of the other research projects studied the
influence of gender inequality in education on the
per capita GDP by applying the Solow model. The
study considered the education of males and
females as the distinct inputs of production. The
discussion shows that per capita GDP is
significantly reduced by gender inequality in
education (15). Similarly, some research shows
that gender inequality in education significantly
contributed to the high level of fertility and
mortality (16, 17, 18). These studies observed the
negative impact of the high levels of fertility
and growth of the population on economic growth.
Gender inequality in education indicates an
indirect link between economic growth and gender
bias in education.
One study analysed
the relationship between earnings on fertility or
gender inequality and economic growth. The
economic growth contracts the gender gap in
incomes, reduced fertility and improved economic
growth. In other words, less developed countries
characterized by the high magnitude of gender gap
in incomes, faced the problem of high fertility
rate and low economic growth. It leads to the
continuous widening of the gender gap in earnings
which leads to a poverty trap (19). However, some
researchers studied the impact of gender
inequality in education on growth. The estimation
of growth regression which incorporates both male
and female years of schooling shows the negative
relationship between the growth and female primary
and secondary education. It indicates the
existence of a higher gap between male and female
schooling which shows backwardness and may be
related to the low level of economic growth (20).
But one study observed the opposite results (21).
The study argued that such findings may be due to
the amalgamation of low growth with the high
magnitude of female education in the country of
Latin America. The study observed a positive
correlation between female secondary education and
growth while a negative correlation between male
secondary education and growth.
Many researchers
studied the distribution of education from a
different perspective in. One of the researchers
studied the distribution of education among males
and females in India in 1971. The study observed
that male persons are more accessible to education
than female persons. It was observed in both rural
and urban areas in India (22). Again, there is a
difference in the distribution of education
between the Dalit and non-Dalit categories in
India during the period 1961 to 2001. The literacy
rates among non SC/ST category people are higher
than SC category people during the period. The
literacy rate was higher among male persons as
compared to female persons in both categories
(23). Again, the distribution of education was
higher among upper-caste Hindus than in Dalit,
Adivasi and Muslim categories in most of the
regions of India during 1999-2000. The educational
gap between the categories decreases at the
primary level in India. However, the percentage of
educated youth under the age of 24-29 increased
among all the categories in India from 1983 to
1999-2000. The male youth aged 24-29 is more
educated than female youth aged 24-29 among all
the categories in India (24). Similarly, research
on the accessibility of education to women
observed that the women’s movement to access the
benefits of education improved the status of
accessibility to education among the women
population in India (25, 26).
Therefore, the
present paper selected the area since there is a
research gap on the present aspect. The Southern
region of India previously consists of four states
Andhra Pradesh, Karnataka, Kerala and Tamil Nadu.
The present paper excluded Telangana and the union
territory from the study. The paper consists of
four sections. After the brief introduction, the
methodology of the paper has been discussed in
section II. The paper applied the Gini coefficient
to investigate the inequality in the education
sector. Then the paper moves to section III which
included the results and a discussion of the
research. Finally, the paper concluded in section
IV. In this section, the paper also suggested some
policy implications for the development of
society.
Research Methodology:
The present paper
studied the inequality in the education sector in
South India. The study applied a familiar method
of estimating inequality known as the Gini
Coefficient. The technique is used to estimate the
education inequality in the states of Andhra
Pradesh, Karnataka, Kerala and Tamil Nadu. The
state of Kerala is famous for the literacy rate
all over India which indicates the development of
the education sector. Similarly, Karnataka is
famous for its rapid urbanization. Therefore, the
primary objective of estimating education
inequality in such states is to observe the
distribution of education among the working
population.
The research
applied the following technique to estimate the
educational inequality –
Education
Inequality IE:
IE=(1/μ)[X2
(Y2-Y1)X1+
X3 (Y3-Y1)X1+X3
(Y3-Y2)X2+
X4 (Y4-Y1)X1+X4
(Y4-Y2)X2+X4
(Y4-Y3)X3+
X5 (Y5-Y1)X1+X5
(Y5-Y2)X2+X5
(Y5-Y3)X3+X5
(Y5-Y4)X4+
X6 (Y6-Y1)X1+X6
(Y6-Y2)X2+X6
(Y6-Y3)X3+X6
(Y6-Y4)X4+X6
(Y6-Y5)X5+
X7 (Y7-Y1)X1+X7
(Y7-Y2)X2+X7
(Y7-Y3)X3+X7
(Y7-Y4)X4+X7
(Y7-Y5)X5+X7
(Y7-Y6)X6]
X1=The
share of illiterate people; X2=The
share of pre-primary completed people; X3=The
share of primary schooling completed people; X4=The
share of middle schooling completed people; X5=The
share of matriculation completed people; X6=The
share of senior secondary completed people; X7=The
share of graduation completed people; Y1=Years
of schooling for illiterate; Y2=Years
of schooling for pre-primary level; Y3=Years
of schooling for primary school level; Y4=Years
of schooling for middle school level; Y5=
Years of schooling for secondary school level; Y6=Years
of schooling for senior secondary level; Y7=Years
of schooling for graduation level.
The paper follows
the following technique to choose the years of
schooling for estimating the Gini coefficient.
Illiterate = 0; Pre-Primary =Y1+ ½Z0=
½Z0; Primary = Y2+ ½Z0=Z0;
Middle School = Z0+3; Secondary School
= Z1; Senior Secondary = Z2;
Graduation = Z2+3
Where, Z0= Period of primary
education, i.e., 4; Z1= Period of
secondary education i.e., 10; Z2=
Period of senior secondary education i.e., 12.
The research
applied regression to estimate the average annual
growth rate of the per capita NSDP in the southern
region of India from 1991 to 2019. Similarly,
regression is applied between the educational
inequality and per capita NSDP in each state of
South India. However, the study faced a lack of
census data of India from 2012. But the study
estimated the data for all the states during the
period 2012 to 2019 based on state-specific
compound growth rates between 2001 to 2011.
Similarly, Telangana formed as a separate state
from the state of Andhra Pradesh in 2014. Prior to
it, the area of Telangana was included under the
state of Andhra Pradesh. Therefore, the results of
Andhra Pradesh included the state of Telangana
from 2014. It has been considered for the
convenience of the comparative analysis. Again,
the period of completion of primary education is
assumed as class IV for all the states to compare
the education inequality among all the states
during the study period.
The key objectives
of the paper are to investigate the following:
- Educational inequality in the southern region
of India.
- Impact of education on mortality in the
southern region of India.
Results and Discussion:
The education
inequality declined in South India during the
period 1991 to 2019. The study observed that
education inequality is highest in Andhra Pradesh
in 1991. The state of Kerala shows the lowest
education inequality since 1991. It implies the
development of the education sector in Kerala. In
other words, the distribution of education
facilities is more equal in Kerala than the other
states of south India. The inequality tends to be
reduced in all the states of the region.
Unfortunately, educational inequality is highest
in Andhra Pradesh than the rest of the states in
2019. However, the rate of reduction of
educational inequality is highest in Tamil Nadu
and lowest in Kerala. The rate of reduction of
inequality is 46.84 % in Tamil Nadu, 39.15 % in
Karnataka, 37.24 % in Andhra Pradesh and 29.13 %
in Kerala from 1991 to 2019.
The following Table
1 shows the results of education inequality in the
both the rural and urban areas of South India
during the period 1991 to 2019. The results show
that rural education inequality is highest in
Andhra Pradesh and lowest in Kerala in 1991. The
results of the state of Kerala implies the proper
distribution of educational benefits among the
rural people in the state. Kerala achieved the
lowest while Andhra Pradesh possesses the highest
position in education inequality in 2019. However,
all the states succeeded to reduce the education
inequality during the period. It implies the
accessibility of the educational benefits of the
sector in the rural areas of these states. The
research observed that the rate of reduction of
rural education inequality is highest in the state
of Tamil Nadu.
|
Table 1: Education Inequality in
Rural Areas of South India
|
|
Years
|
Andhra Pradesh
|
Karnataka
|
Kerala
|
Tamil Nadu
|
|
Rural
|
Urban
|
Rural
|
Urban
|
Rural
|
Urban
|
Rural
|
Urban
|
|
1991
|
0.79
|
0.54
|
0.70
|
0.44
|
0.33
|
0.30
|
0.65
|
0.44
|
|
2001
|
0.67
|
0.45
|
0.62
|
0.40
|
0.33
|
0.30
|
0.56
|
0.43
|
|
2011
|
0.59
|
0.41
|
0.53
|
0.35
|
0.30
|
0.28
|
0.46
|
0.34
|
|
2019
|
0.50
|
0.37
|
0.44
|
0.30
|
0.24
|
0.24
|
0.35
|
0.26
|
|
Source: Own Calculation using Census Data
of India.
|
The Table 1 also
shows the education inequality in the urban areas
of South India during the period 1991 to 2019. The
research observed that urban educational
inequality is highest in Andhra Pradesh and lowest
in Kerala in 1991. However, inequality declined in
each state of the region during the period.
Unfortunately, Andhra Pradesh still shows the
highest educational inequality as compared to the
other states in 2019. One of the key observations
is that educational inequality is lower in the
urban areas as compared to the rural areas in each
state of the region during the period. It is
because of the higher development of the education
sector in the urban areas as compared to rural
areas. The rate of reduction of urban educational
inequality is highest in Tamil Nadu and lowest in
Kerala. The rate of reduction of urban educational
inequality is 39.66 per cent in Tamil Nadu, 32.74
per cent in Karnataka, 30.61 per cent in Andhra
Pradesh and 21.45 per cent in Kerala from 1991 to
2019. Such reduction in educational inequality
shows the development of the education sector in
the region. In other words, it implies a more
equal distribution of the educational benefits
among the population in the region.
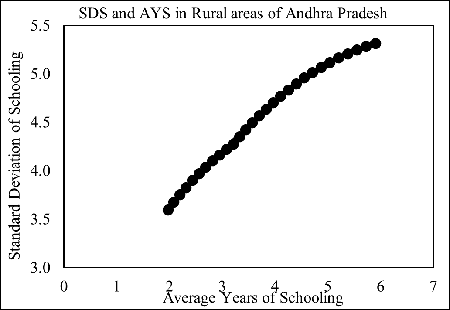
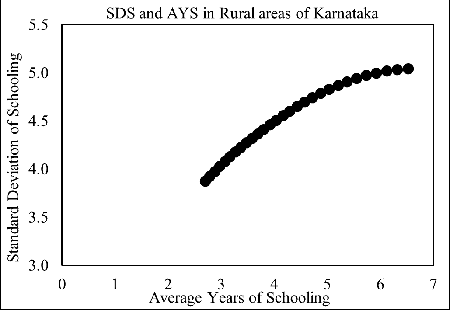
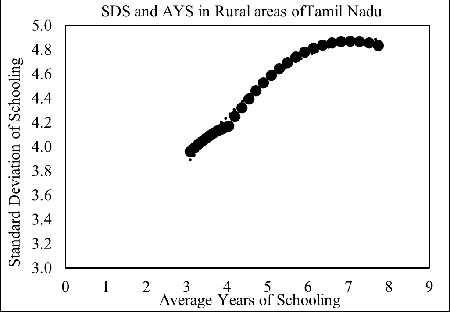
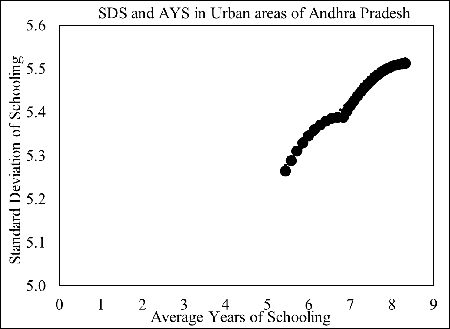
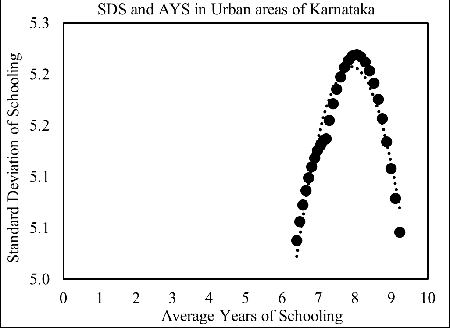
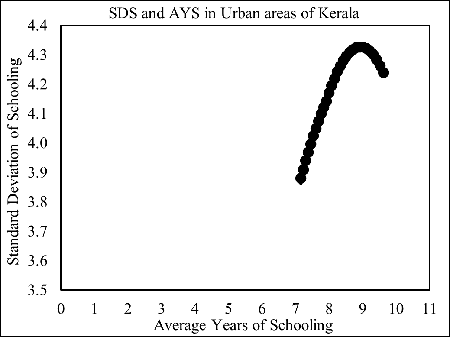
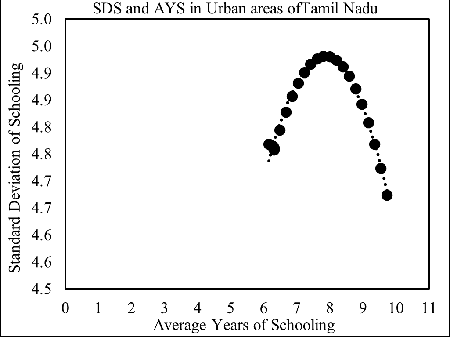
The study observed
the increasing pattern of the standard deviation
of schooling in all the states of South India
during the period 1991 to 2019. The pattern is
different in the rural areas as compared to the
urban areas. The pattern tends to increase more in
the rural areas than the urban areas. The standard
deviation of schooling for the rural areas is
lowest in Andhra Pradesh and highest in Tamil Nadu
in 1991. But it’s highest in Andhra Pradesh and
lowest in Kerala in 2019. However, the standard
deviation of schooling for urban areas is highest
in Andhra Pradesh and lowest in Kerala during the
period 1991 to 2019. As the estimation considered
the standard deviation of schooling for the entire
state, Andhra Pradesh shows the second-lowest
position after Kerala in 1991 and occupied the
topmost place in 2019.
The average years
of schooling is one of the important factors of
reduction of education inequality. The research
observed that the average years of schooling above
the age of 15 years is highest in Kerala during
the period 1991 to 2019. The state of Tamil Nadu
shows significant improvement in the average years
of schooling. Again, Andhra Pradesh occupied the
lowest place in the order. However, all the states
succeeded to increases the average years of
schooling above the age of 15 years during the
period. The trend of average years of schooling
above 15 years in the rural areas of South India
shows almost the same results as the results of
the overall state. However, such a trend varies in
the case of urban areas of South India. The
average years of schooling above 15 years is
highest in Kerala while Tamil Nadu shows
second-lowest in 1991. But Tamil Nadu surpassed
Kerala and shows better performance in urban areas
in 2019. Though the state of Andhra Pradesh shows
some better performance than Tamil Nadu from 1998
to 2006, the state still occupied the lowest place
in 2019. However, overall, all the states show
improvement during the period.
The study observed
the negative relationship between the average
years of schooling and education inequality. The
distribution of educational benefits among the
population is significantly related to the average
years of schooling. The increase in average years
of schooling reduces the educational inequality in
the region. The study observed such a negative
relationship in each state of South India from
1991 to 2019. The development of the education
sector leads to the extension of average of years
of schooling and contributed to the reduction of
education inequality in Kerala.
However, the degree
of relationship differs across the state. For
example, the relationship between the average
years of schooling and educational inequality is
different in Kerala than in any other states. The
study found a concave curve type relationship in
Kerala. It implies that Kerala requires to
increase in average years of schooling at a lower
rate as compared to the other states in both rural
and urban areas of the state to reduce the
education inequality. It is because Kerala already
achieved significant development in the education
sector. The convex curve shows the opposite
meaning. The states Andhra Pradesh and Tamil Nadu
shows a convex curve in the rural areas.
The government of
the state of Andhra Pradesh requires large
expansion of the education sector as compared to
Kerala to reduce the education inequality in the
Andhra Pradesh. The development of the education
sector may increase the accessibility of
educational benefits in Andhra Pradesh. The
improvement of the educational qualification leads
to the reduction of education inequality. It other
words, it implies the more equal distribution of
education resources among the people in the state.
The state of Kerala achieved significant
development in the education sector and leads to
highest improvement in the reduction of education
inequality as compared to the other states (Andhra
Pradesh, Karnataka and Tamil Nadu) in the southern
region of India since 1991 to 2019.
The study observed
that the states characterized by higher average
years of schooling achieved a more equitable
distribution of education as compared to the
states characterized by lower average years of
schooling. For example, Kerala has higher average
years of schooling than any other state which
leads the state to achieve the lowest educational
inequality in 1991. Similarly, the state of Kerala
continuously succeeded to reduce educational
inequality due to the increases in average years
of schooling which implies the existence of more
equitable distribution of education in the state
than in any other state. However, Andhra Pradesh
shows the opposite results during the period.
Educational
Kuznets Curve in South India:
The present study
investigated whether the distribution of education
worsens before it improves. To answer the
question, the study estimated the Kuznets curve
for the region. The results highlight that some of
the states have the pattern of the Kuznets curve.
In case of the overall state, Kerala and Tamil
Nadu shows the pattern.
However, the state
of Kerala shows such a Kuznets type curve in rural
areas. The state of Tamil Nadu is also inclined to
show such a pattern. Again, the states Karnataka,
Kerala and Tamil Nadu shows the pattern of the
Kuznets curve in urban areas. The pattern of the
Kuznets curve implies that as the state shifted
from the minimum say 0 to the highest education
level, at first variance increases while it
declines during the later period. However, such a
Kuznets curve was never found while considering
education Gini instead of the standard deviation
of schooling.
The Relationship
between Per Capita NSDP and Education Gini in
South India:
The study observed
that all the states of the southern region of
India has a significant growth in the per capita
NSDP since 1991 to 2019. The state of Andhra
Pradesh has the highest growth in the per capita
NSDP in the region. The following Table 2 shows
the results.
|
Table 2: Growth of Per Capita
NSDP in South India from 1991 to 2019
|
|
States
|
Coefficient
|
t-Statistics
|
R-Squared
|
P-Value
|
|
Andhra Pradesh
|
0.0765
|
6.0820
|
0.9791
|
0.0000
|
|
Karnataka
|
0.0524
|
19.2751
|
0.9937
|
0.0000
|
|
Kerala
|
0.0577
|
26.2856
|
0.9987
|
0.0000
|
|
Tamil Nadu
|
0.0585
|
15.1880
|
0.9957
|
0.0000
|
|
Source: Own Calculation using Census Data
of India.
|
The expansion of
education sector facilitated to access the
benefits of education among the people in the
society. The accessibility to education improved
the educational qualification of the people. The
improvement in the educational qualification
expanded the income sources to the people. It
contributed to the improvement of the economic
well-being of people.
|
Table 3: Linkage between Per
Capita NSDP and Education Gini from 1991
to 2019
|
|
States
|
Coefficient
|
t-Statistics
|
R-Squared
|
P-Value
|
|
Andhra Pradesh
|
-4.571
|
-4.0408
|
0.9777
|
0.0004
|
|
Karnataka
|
-3.004
|
-20.2988
|
0.9946
|
0.0000
|
|
Kerala
|
-2.566
|
-2.7152
|
0.9916
|
0.0118
|
|
Tamil Nadu
|
-2.577
|
-13.4551
|
0.9952
|
0.0000
|
|
Source: Own Calculation using Census Data
of India.
|
The study observed
the negative relationship between the per capita
NSDP and education Gini in the states of South
India from 1991 to 2019. The education Gini is the
independent variable and per capita NSDP is the
dependent variable. It implies that as educational
inequality reduces in the state, it leads to an
increase in per capita NSDP in the state.
Therefore, equal distribution of education is
important to grow the per capita NSDP in all the
states of the region.
Role of
Education on Health:
The following Table
4 shows the number of colleges in each state of
the region.
|
Table 4: Under-Graduate Medical
Colleges in South India
|
|
Year
|
Andhra Pradesh
|
Karnataka
|
Kerala
|
Tamil Nadu
|
|
AYUSH
|
Ayur
|
Homeo
|
AYUSH
|
Ayur
|
Homeo
|
AYUSH
|
Ayur
|
Homeo
|
AYUSH
|
Ayur
|
Homeo
|
|
1991
|
10
|
4
|
4
|
18
|
9
|
8
|
10
|
5
|
5
|
7
|
2
|
2
|
|
1996
|
10
|
4
|
4
|
50
|
36
|
12
|
10
|
5
|
5
|
9
|
3
|
3
|
|
2001
|
10
|
4
|
4
|
62
|
47
|
12
|
9
|
5
|
4
|
18
|
4
|
11
|
|
2006
|
11
|
4
|
4
|
70
|
51
|
12
|
20
|
14
|
5
|
22
|
6
|
10
|
|
2011
|
18
|
7
|
6
|
77
|
59
|
11
|
23
|
17
|
5
|
27
|
5
|
10
|
|
2016
|
7
|
1
|
4
|
78
|
59
|
11
|
23
|
17
|
5
|
30
|
5
|
12
|
|
2019
|
11
|
3
|
5
|
102
|
75
|
14
|
26
|
18
|
6
|
37
|
6
|
12
|
|
Source: Own Classification based on EPWRF
Data.
|
Education is one of
the important factors for better health status.
The improvement of education qualification helps
to reduce the mortality rate of children. The
expansion of health is important to access such
goal. The study observed that medical colleges are
increased in each state of the region. It extended
the admission capacity of the students to study
different types of medical courses in the region
since availability of doctors is important to
reduce the mortality rate of children. The
availability or engagement of doctors or
men-powers depends on the availability of colleges
to study medical courses.
The following Table
5 shows the engagement of men-power in the health
sector in each state of the region since 1991 to
2019.
|
Table 5: Men Power Engaged in
Health Sector in South India
|
|
Auxiliary Nurse Midwives
|
Registered Nurses and Registered
Midwives
|
Lady Health Visitors
|
|
Year
|
Andhra Pradesh
|
Karnataka
|
Kerala
|
Tamil Nadu
|
Andhra Pradesh
|
Karnataka
|
Kerala
|
Tamil Nadu
|
Andhra Pradesh
|
Karnataka
|
Kerala
|
Tamil Nadu
|
|
1991
|
18270
|
20707
|
6738
|
8439
|
NA
|
NA
|
NA
|
NA
|
1231
|
3787
|
674
|
1562
|
|
1996
|
50582
|
21734
|
7758
|
37885
|
NA
|
NA
|
NA
|
NA
|
2480
|
3985
|
748
|
5851
|
|
2001
|
88726
|
37325
|
18840
|
35172
|
81014
|
82420
|
64870
|
109670
|
2480
|
5875
|
748
|
8565
|
|
2006
|
101529
|
47407
|
28043
|
53290
|
94569
|
64308
|
81511
|
165404
|
2480
|
6836
|
7847
|
11087
|
|
2011
|
121159
|
51109
|
28979
|
54635
|
168947
|
187053
|
136341
|
202949
|
2480
|
6840
|
8144
|
11112
|
|
2016
|
138435
|
54039
|
30173
|
56630
|
232621
|
231643
|
246161
|
262718
|
2480
|
6840
|
8507
|
11180
|
|
2019
|
138781
|
54039
|
30862
|
58788
|
237682
|
231643
|
282178
|
300856
|
2480
|
6840
|
8507
|
11254
|
|
Source: Classification based on EPWRF
data. #NA – Not Available.
|
The employment of
men-power increased in the health sector of each
state of the region. An increase in engagement of
men-power increased the availability of men-power
per thousand population. It helped to reduce the
mortality rate in the region. The government
provides employment opportunities to several
people to reduce the mortality rate. The study
observed that employment of auxiliary nurse
midwives significantly increased in each state of
the region. The engagement of auxiliary midwives
is vital for the society since they were the first
contact person or primary health worker to deal
with maternal and child health related issue
specially in the village areas. They played a
major role in the health department. Similarly,
lady health visitors increased in each state of
the region since 1991. It is important to employ
lady doctor to reduce the mortality rate in the
region.
The study observed
that the mortality rate of age group 0 – 4 was
decreased in each state of the region. It was
decreased from 21.3 in 1991 to 8.3 in 2019 in
Andhra Pradesh. However, it was 22.2 in 1991 and
reduced to 9.3 in 2019 in the rural areas of
Andhra Pradesh. Similarly, it reduced from 21.4 in
1991 to 6 in 2019 in Karnataka while 24.6 in 1991
to 6.6 in 2019 in the rural areas of Karnataka.
Again, it reduced from 4.3 in 1991 to 1.8 in 2019
in Kerala. The rural areas of Kerala show higher
improvement as compared to other states. The rural
areas of Kerala reduction of mortality rate from
4.3 in 1991 to 1.9 in 2019. Tamil Nadu succeeded
to reduce mortality rate from 16.1 in 1991 to 3.8
in 2019. It was 18.4 in 1991 and reduced to 4.3 in
2019 in the rural areas of Tamil Nadu. The study
observed that Kerala has low mortality rate among
all the states in the region during the period
1991 to 2019. The following Table 6 shows the
child mortality rate under the age group 0 – 4 per
thousand population in each state of the region
since 1991.
|
Table 6: Child Mortality Rate:
Age Group 0-4
|
|
Year
|
Andhra Pradesh
|
Karnataka
|
Kerala
|
Tamil Nadu
|
|
Total
|
Rural
|
Total
|
Rural
|
Total
|
Rural
|
Total
|
Rural
|
|
1991
|
21.3
|
22.2
|
21.4
|
24.6
|
4.3
|
4.3
|
16.1
|
18.4
|
|
1996
|
17.8
|
19.9
|
16.6
|
20.4
|
3.8
|
3.6
|
12.6
|
14.0
|
|
2001
|
15.7
|
18.1
|
15.0
|
19.3
|
2.7
|
2.9
|
11.8
|
12.6
|
|
2006
|
15.2
|
18.3
|
12.5
|
15.0
|
3.2
|
3.4
|
9.2
|
9.7
|
|
2011
|
9.1
|
11.0
|
9.2
|
10.5
|
2.7
|
2.9
|
5.4
|
5.6
|
|
2016
|
10.1
|
11.3
|
6.7
|
7.9
|
2.3
|
2.4
|
4.3
|
5.0
|
|
2019
|
8.3
|
9.3
|
6.0
|
6.6
|
1.8
|
1.9
|
3.8
|
4.3
|
|
Source: Classification based on EPWRF
data.
|
The role education
is important for the improvement of health
condition. The expansion of education
qualification increased the education of people.
It helped to take care of their children for
better health. It may lead to reduction of child
mortality rate in the region.
|
Table 7: Linkage between Child
Mortality Rate and Education Gini from
1991 to 2019
|
|
States
|
Coefficient
|
t-Statistics
|
R-Squared
|
P-Value
|
|
Andhra Pradesh
|
1.9767
|
14.94
|
0.8921
|
0.0000
|
|
Karnataka
|
2.7172
|
33.85
|
0.9770
|
0.0000
|
|
Kerala
|
1.6240
|
6.28
|
0.5938
|
0.0000
|
|
Tamil Nadu
|
2.5429
|
27.50
|
0.9655
|
0.0000
|
|
Source: Own Calculation using Census Data
of India. # Education Gini is the
independent variable.
|
The study observed
an inverse relationship between the child
mortality rate and education Gini in each state of
the region. It was highest in the state of
Karnataka. The expansion of education sector
improved the education qualification of the people
and it leads to the reduction of child mortality
rate in Karnataka. Similarly, the study observed
that expansion of education sector leads to the
reduction of child mortality rate in each state of
the region. It is because of improvement of
education qualification educated the people and
educated people cared their child better as
compared to uneducated people. Since the
government significantly increased the employment
in the health workers, it also helped to reduce
the child mortality rate in the region. They
helped to train the people how to take care their
child. The trained people lead cared their child
better and contributed to the reduction of
mortality rate. Therefore, the study observed that
education played the key role in the reduction of
child mortality rate in the region.
Conclusion:
The study observed
different rates of educational inequality in the
states of South India from 1991 to 2019. The
educational inequality is highest in Andhra
Pradesh and lowest in Kerala in both the rural and
urban areas. The results confirmed the inclining
pattern of the standard deviation of schooling in
all the states of South India. The pattern tends
to increase more in the rural areas than the urban
areas. The distribution of educational benefits
among the population is significantly related to
the average years of schooling. The increase in
average years of schooling reduces the educational
inequality in the region. The average years of
schooling above the age of 15 is highest in the
state of Kerala. The state of Tamil Nadu shows
significant improvement in the increases in
average years of schooling. The state of Kerala
shows the Kuznets curve between the standard
deviation of schooling and average years of
schooling in rural areas. The present study
observed the negative relationship between the per
capita NSDP and education Gini in the states of
South India. The state of Andhra Pradesh requires
to extend the education sector to access the
educational benefits by the people in the state.
The expansion of education sector leads to
reduction of child mortality rate in each state of
the region.
References
- Neckerman KM, Torche F. Inequality: Causes
and Consequences. Annual Review of
Sociology. 2007;33:335-357.
- Montt G. Cross-national Differences in
Educational Achievement Inequality. Sociology
of Education. 2011;84(1):49-68.
- Lin CHA, Yang CH. An Analysis of Educational
Inequality in Taiwan after the Higher Education
Expansion. Social Indicators Research.
2009;90(2):295-305.
- Dorius SF. The Rise and Fall of Worldwide
Education Inequality from 1870 to 2010:
Measurement and Trends. Sociology of
Education. 2013;86(2):158-173.
- Guppy N, Mikicich PD, Pendakur R. Changing
Patterns of Educational Inequality in Canada.
The Canadian Journal of Sociology/Cahiers
Canadiens de Sociologie.
1984;9(3):319-331.
- Velaskar P. Unequal Schooling as a Factor in
the Reproduction of Social Inequality in India.
Sociological Bulletin.
1990;39(1/2):131-145.
- Pfeffer FT. Persistent Inequality in
Educational Attainment and Its Institutional
Context. European Sociological Review.
2008;24(5):543-565.
- Buchmann C, Hannum E. Education and
Stratification in Developing Countries: A Review
of Theories and Research. Annual Review of
Sociology. 2001;27:77-102.
- Lin CHA. Education Expansion, Educational
Inequality, and Income Inequality: Evidence from
Taiwan, 1976-2003. Social Indicators
Research. 2007;80(3):601-615.
- Dasgupta P, Weale M. On Measuring the Quality
of Life. World Development.
1992;20(1):119-131.
- Lau LJ, Jamison DT, Louat FF. Education and
Productivity in Developing Countries. World
Development Report, Policy, Research and
External Affairs Working Papers, Working Paper
Series 612. 1991.
- Ram R. Educational Expansion and Schooling
Inequality: International Evidence and Some
Implications. The Review of Economics and
Statistic. 1990;72(2):266-274.
- Klasen S. Low Schooling for Girls, Slower
Growth for All? Cross-Country Evidence on the
Effect of Gender Inequality in Education on
Economic Development. The World Bank
Economic Review. 2002;16(3):345-373.
- King EM, Hill MA. Women’s Education in
Developing Countries: Barriers, Benefits and
Policies. The World Bank. 1993.
- Knowles S, Lorgelly PK, Owen D. Are
Educational Gender Gaps a Brake on Economic
Development? Some Cross-Country Empirical
Evidence. Oxford Economic Papers.
2002;54(1):118-149.
- Klasen S. Does Gender Inequality Reduce Growth
and Development? Evidence from Cross-Country
Regressions. World Bank Policy Research Report
Working Paper No. 7. 2000.
- Murthi M, Guio AC, Drèze J. Mortality,
Fertility, and Gender Bias in India: A
District-Level Analysis. Population and
Development Review. 1995;21(4):745-782.
- Schultz TP. Human Capital, Family Planning,
and Their Effects on Population Growth. The
American Economic Review.
1994;84(2):255-260.
- Galor O, Weil DN. The Gender Gap, Fertility,
and Growth. The American Economic Review.
1996;86(3):374-387.
- Barro RJ, Lee JW. Sources of Economic Growth.
Carnegie-Rochester Conference Series on Public
Policy 40, 1994. p. 1-46.
- Dollar D, Gatti R. Gender Inequality, Income,
and Growth: Are Good Times Good for Women. The
World Bank, Policy Research Report on Gender and
Development, Working Paper Series, No. I. 1999.
- Tilak JGG. Inequality in Education by Sex in
India. Indian Journal of Industrial
Relations. 1983;18(3):375-395.
- Benjamin J. Dalit and Higher Education in
India. The Indian Journal of Political
Science. 2008;69(3):627-642.
- Desai S, Kulkarni V. Changing Educational
Inequalities in India in the Context of
Affirmative Action. Demography.
2008;45(2):245-270.
- Kamat AR. Women's Education and Social Change
in India. Social Scientist.
1976;5(1):3-27.
- Patel I. The Contemporary Women's Movement and
Women's Education in India. International
Review of Education/Internationale Zeitschrift
für Erziehungswissenschaft/Revue
Internationale de l'Education.
1998;44(2/3):155-175.
|