|
Introduction
Polycystic
ovary syndrome (PCOS) is a heterogeneous disorder
affecting women of the reproductive age (e.g.,
15-44 years) which adversely influences the
fertility and reproductive health of the women
[1,2] and the etiology of PCOS is still an area of
active research [3,4]. Further, PCOS reported
various complexity with oligomenorrhea (irregular
menstrual cycle), amenorrhea (no menstruation),
and enlarged ovaries with multiple cysts [5-7].
The prevalence rate of PCOS is highly variable,
ranging from 2.2–26% [8]. The rates of PCOS have
been reportedly high among Indian women [9-12].
The clinical symptoms of PCOS include obesity,
impaired glucose tolerance, type-2 diabetes
mellitus, metabolic syndrome, and possibly
cardiovascular events, and also causes various
mental events such as anxiety and depression
[4,13-17]. However, different categories in the
clinical manifestations of PCOS have been
distinguished according to the Rotterdam criteria
[18]. These included PCOS that is characterized by
the presence or absence of ovarian cysts with
excessive androgen secretion and irregular
menstrual periods, and PCOS that is characterized
by the presence of increased androgen secretion
and multiple cysts, and one with irregular
menstruation and multiple cysts [18,19]. Several
studies have postulated PCOS as a lifestyle
disorder that is linked to the environment and
standard of living of women [9-11,20,21]. Thus, an
attempt has been made to determine the prevalence
and compare of PCOS between rural and urban
communities in Kamrup (Metro) and Kamrup (Rural)
districts of Assam, Northeast India.
Materials and Methods
The cross-sectional
study was carried out in the Pratiksha Hospital of
Guwahati, Kamrup (Metro), Northeast India. The
study was conducted with approval from the
Department of Gynecology, Pratiksha Hospital,
Guwahati. The present investigation focused on
reproductive women who suffered from PCOS and
sought medical assistance related to reproductive
health issues and infertility in the hospital. The
present study sample comprises 150 Assamese caste
women who visited the Department of Gynecology,
Pratiksha Hospital, Guwahati, of which 75 women
from the urban and 75 women from rural areas of
Guwahati utilizing a stratified random sampling
method. All the participants were enrolled after
obtaining informed consent to participate and the
nature of participation in this study. The
participants were interviewed to obtain the
necessary data separately. All the factors were
undertaken based on Rotterdam criteria (2004).
Rotterdam criteria are the most widely-used tool
for diagnosing PCOS including the presence of
irregular menstrual cycle (Oligomenorrhea) or no
menstruation (Amenorrhea), hyperandrogenism (signs
of hirsutism), serum insulin, serum
Luteinizing hormone (LH) and Follicle stimulating
hormone (FSH), and polycystic ovaries on
ultrasound [22]. A pre-structured research
schedule was used to obtain the socio-economic and
demographic data which includes age, family
pattern, educational level, and physical labor
among the study participants and data on the
dietary patterns of the participants were obtained
which is categorized as vegetarian and
non-vegetarian.
Given that the
present study is a hospital-based pilot
investigation, the pertinent information on
anthropometric measurements, such as height and
weight, as well as various biological parameters,
such as oligomenorrhea, serum testosterone, serum
insulin, serum FSH, and ultrasonography, was
obtained from the medical reports of the present
study participants. The research participants
belonging to the Assamese community aged 18-35
years are included in the study. Women having the
symptoms of oligomenorrhea (inter-menstrual
interval >35 days or 8 menstrual cycles per
year were considered. Women with clinical signs of
hirsutism, acne, and polycystic ovarian morphology
with 12 or more follicles are observed in at least
one ovary and these symptoms were record-based
studies along with interviews). However,
reproductive women aged between 18 years and 35
years were not included in the present study. The
objectives of the present investigation and the
nature of participation were explained to the
research participants before their participation
in the present study. All the participants were
enrolled in the present investigation after
obtaining informed consent to participate in this
study. The data were obtained by using
semi-structured questionnaires and anthropometric
assessments were collected using a measuring tape,
weighing scale, and anthropometer.
Socio-demographic and lifestyle data were
collected by utilizing a pre-structured schedule
which includes the family pattern, education and
work activity.
Anthropometric
measurements include the height and weight using
standard procedures [23]. For the anthropometric
measurements of weight and height, the
participants were asked to be without footwear and
wearing light clothes. Waist circumference (WC)
and hip circumferences (HC) were measured by using
measuring tape nearest 0.1 cm. For WC superior
part of the hip bone was palpated and then
measurement tape was encircled around the stomach
just above this point and the umbilicus
interiorly. The HC was measured by encircling the
measuring tape in the broadest part of the hip of
the participants. During the time of measurements,
the participants were asked to stand in the
eye-ear plane, height was measured by using an
anthropometric rod nearest to 0.1 cm and weight
was measured by using a weighing scale nearest to
0.1 kg. The Body Mass Index (BMI) of research
participants was calculated by dividing weight
(kg) by height in square meters [24]. BMI was
found to be greater than 30.00 kg/m2 categories
as obese [24]. Work activity levels were also
obtained utilizing the self-reported responses
based on their physical activity using the
self-administered schedule method.
Statistical analysis
The collected data
were entered into Microsoft Excel and analyzed in
the Statistical Package for Social Sciences
(Version 16.0). The continuous variables were
presented in terms of descriptive statistics of
mean, standard deviation, and range distribution.
The Chi-square analysis was performed to determine
the frequency differences in categorical
variables. A mean comparison between categories
was done utilizing t-test analysis. Spearman’s
rank correlation coefficient is performed to
observe the strength of correlation based on the
dietary habits of the studied community. A p-value
<0.05 was considered to be statistically
significant.
Results
Table 1 shows the
socio-economic and demographic results of the
studied Assamese caste community that reported the
highest percentage of PCOS group within the age
group of 24-29 years belonging to urban areas, and
the average age was estimated at 25.97±1.84 years
(62.71%) and in rural areas the average age was
estimated at 26.92±1.76 years (51.02%). The study
showed that the majority of urban participants
with PCOS are from the nuclear family structure
(91.53%) as compared to the joint family (8.47%).
The results on the level of education showed a
higher proportion of women with PCOS who had
passed HSSLC to Bachelor’s degree are from urban
areas (47.46%) in comparison to women in rural
areas (36.73%).
|
Table 1: Socio-economic and
Demographic Profile of the studied rural
and urban community of Assam, India.
|
|
Variables assessed
|
Rural (N=75)
|
Urban (N=75)
|
Chi-square
value(𝝌2)
|
p – value
|
|
PCOS Group
(N=49)
|
NON-PCOS Group (N=26)
|
PCOS Group
(N=59)
|
NON-PCOS Group (N=16)
|
|
Number
Mean ± SD
|
%
|
Number
Mean ± SD
|
%
|
Number
Mean ± SD
|
%
|
Number
Mean ± SD
|
%
|
|
Age Groups
|
|
18 – 23 years
|
08
20.63 ± 1.80
|
16.33
|
05
21.00 ± 1.41
|
19.23
|
09
21.22 ± 1.69
|
15.25
|
04
20.00 ± 1.22
|
25.00
|
0.17
|
0.68
|
|
24 – 29 years
|
25
26.92 ± 1.76
|
51.02
|
17
26.47 ± 1.79
|
65.38
|
37
25.97 ± 1.84
|
62.71
|
03
26.67 ± 1.70
|
18.75
|
12.08
|
0.00051
|
|
30 – 35 years
|
16
33.81 ± 1.67
|
32.65
|
04
32.50 ± 1.80
|
15.38
|
13
33.39 ± 1.64
|
22.03
|
09
33.38 ± 1.64
|
56.25
|
2.15
|
0.15
|
|
Types of families
|
|
Nuclear Family
|
32
|
65.31
|
18
|
69.23
|
54
|
91.53
|
14
|
87.50
|
2.96
|
0.09
|
|
Joint Family
|
17
|
34.69
|
08
|
30.77
|
05
|
8.47
|
02
|
12.50
|
0.03
|
0.86
|
|
Education level
|
|
Primary to HSLC
|
15
|
30.61
|
02
|
7.69
|
09
|
15.25
|
02
|
12.50
|
0.22
|
0.64
|
|
HSSLC to Bachelor’s Degree
|
18
|
36.73
|
20
|
76.92
|
28
|
47.46
|
12
|
75.00
|
4.13
|
0.04
|
|
Post Graduate Degree & Others
|
10
|
20.41
|
05
|
19.23
|
22
|
37.29
|
02
|
12.50
|
3.92
|
0.04
|
|
(Significant level calculated at
< 0.05)
|
Table 2 shows the
percentage of recent weight gain, obese,
non-obese, and work activity level of the studied
community, and reported participants with recent
weight gain are found to be higher in urban areas
(38.66%) as compared to rural areas (9.33%). Obese
women are also found to be higher in urban
(20.00%, 32.43±1.77) as compared to rural areas
(8.00%, 32.74±2.02). The proportion of non-obese
PCOS women is found to be higher in rural areas
(92.00%, 22.37±2.46) as compared to urban areas
(80.00%, 22.24±2.09). Working activity level is
higher in rural areas (30.66%) as compared to
urban areas (9.33%).
|
Table 2: Comparison of Details in
Rural and Urban community based on
Recent Weight Gain, Obese, Non obese and
Work Activity of Assam, India
|
|
Characters
|
Rural (N=75)
|
Urban (N=75)
|
Chi-square value (𝝌2)/
t-value
|
p – value
|
|
No. of patients
Mean ± SD
[Range]
|
%
|
No. of patients
Mean ± SD
[Range]
|
%
|
|
Recent weight Gain
|
7
|
9.33
|
29
|
38.66
|
13.44
|
0.00
|
|
Proportion of Individuals with
Obesity
|
|
Obese
(BMI ≥ 30 kg/m2)
|
6
32.74 ± 2.02
[30 – 35]
|
8.00
|
15
32.43 ± 1.77
[30 – 36]
|
20.00
|
𝝌2=3.86
t=0.03
|
0.49
|
|
Non obese
(BMI ≤ 29.99 kg/m2)
|
69
22.37 ± 2.46
[18.6 – 29.5]
|
92.00
|
60
22.24 ± 2.09
[18.6 – 29.5]
|
80.00
|
𝝌2=0.63
t=0.30
|
0.43
|
|
Work Activity
|
23
|
30.66
|
7
|
9.33
|
8.53
|
0.00
|
|
(Significant level calculated at
<0.05)
|
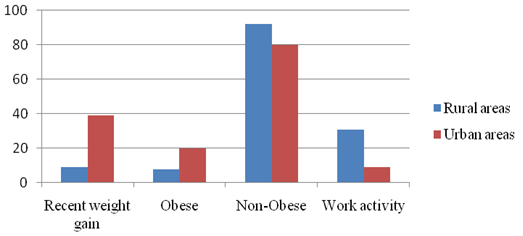 |
| Figure
1: Histogram showing Recent Weight Gain,
Obese, non-obese in Rural and Urban areas
of Assam, India |
Table 3 shows the
dietary pattern of the studied community between
PCOS and Non-PCOS group which is categorized as
vegetarian and non-vegetarian diet. The results
showed highest percentage of women suffering from
PCOS to be non-vegetarian (88.88%) and the women
with PCOS in the category of vegetarian diet to be
11.11%. The Spearman’s rank correlation analysis
was performed between the vegetarian and
non-vegetarian women having PCOS and the results
showed to be rho = 0.8 which signifies a strong
correlation between them. Chi-square analysis was
also performed to observe the significant
difference between women with PCOS in vegetarian
and non-vegetarian diet and the result was found
to be non-significant (p>0.05).
|
Table 3: Dietary Pattern of the
studied rural and urban community of
Assam, India
|
|
Variables assessed
|
Rural (N=75)
|
Urban (N=75)
|
Spearman’s Rank Correlation Value
|
Chi-square value
|
|
PCOS Group
(N=49)
|
NON-PCOS Group (N=26)
|
PCOS Group
(N=59)
|
NON-PCOS Group (N=16)
|
|
Number
|
%
|
Number
|
%
|
Number
|
%
|
Number
|
%
|
|
Age Groups
|
Vegetarian
|
|
|
|
18 – 23 years
|
1
|
2.04
|
2
|
7.69
|
2
|
3.39
|
1
|
6.25
|
0.8
(strong correlation)
|
X2= 0.07471
p value = 0.7845
(not significant)
|
|
24 – 29 years
|
2
|
4.08
|
2
|
7.69
|
3
|
5.09
|
1
|
6.25
|
|
30 – 35 years
|
2
|
4.08
|
1
|
3.85
|
2
|
3.39
|
2
|
12.50
|
|
Non-Vegetarian
|
|
18 – 23 years
|
7
|
14.29
|
3
|
11.54
|
7
|
11.86
|
3
|
18.75
|
|
24 – 29 years
|
23
|
46.94
|
15
|
57.69
|
34
|
57.63
|
2
|
12.50
|
|
30 – 35 years
|
14
|
28.57
|
3
|
11.54
|
11
|
18.64
|
7
|
43.75
|
|
(Significant level calculated at
<0.05)
|
Table 4 shows the
biological parameters based on hirsutism, serum
testosterone, serum insulin (raised and normal
limit), serum luteinizing hormone (LH), serum
follicle-stimulating hormone (FSH), and
ultrasonography. The results showed women in urban
areas have a higher proportion of hirsutism
(33.33%) which indicates a higher androgen
activity is prevalent in urban areas.
Oligomenorrhea or irregular menstruation is
reported to be higher in urban areas (53.33%) as
compared to rural areas (14.66%). Raised levels of
serum testosterone are found in urban areas
(40.00%, 55.32±5.54) and there is no statistical
significance between rural and urban areas. Raised
serum insulin which is common among PCOS women and
can be considered an integral part of the syndrome
is found to be in higher proportion in urban areas
as compared to rural areas (40.00%, 19.03±5.88)
and (34.66%, 18.10±7.08) respectively. Within the
normal limit for serum insulin, women with PCOS in
urban areas (60.00%, 8.27±3.27) showed a lower
percentage as compared to rural (65.33%,
9.46±3.40). Serum luteinizing hormone (LH) beyond
the normal range (10-20) mlU/mL is found to be
higher in rural areas (32.00%, 11.32±2.02) in
comparison to urban areas (24.00%, 11.51±1.92).
Within the normal limit range for LH (5-9.9
mIU/mL) is found to be higher in urban areas
(76.00%, 7.75±1.31) in comparison to rural areas
(68.00%, 7.60±1.64). Serum FSH level was found to
be the same both in urban and rural areas. The
proportion of patients diagnosed with PCOS through
ultrasonography with follicles ≥12 in urban areas
versus rural areas (78.66% vs. 60.00%).
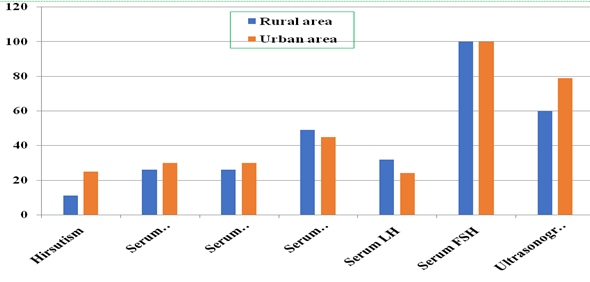 |
| Figure
2: Histogram showing Hirsutism, Serum
testosterone, Serum Insulin (raised and
normal limit), Serum LH, FSH and
Ultrasonography reports in Rural and Urban
areas of Assam, India. |
|
Table 4: Comparison in Rural and
Urban areas based on Hirsutism, Serum
testosterone, Serum Insulin (raised and
normal limit), Serum Luteinizing
hormone, Serum Follicle stimulating
hormone and Ultrasonography reports of
Assam, India
|
|
Characters
|
Rural (75)
|
Urban (75)
|
Chi-square
(X2)/t-
value
|
p – value
|
|
No. of patients
Mean ± SD
[Range]
|
%
|
No. of patients
Mean ± SD
[Range]
|
%
|
|
Hirsutism
|
11
|
14.66
|
25
|
33.33
|
5.44
|
0.01
|
|
Oligomenorrhea
|
11
|
14.66
|
40
|
53.33
|
16.49
|
0.00
|
|
Serum testosterone
(ng/dL)
|
26
54.60 ± 5.04
[43 – 63]
|
34.66
|
30
55.32 ± 5.54
[43 – 63.5]
|
40.00
|
X2=0.29
t=0.50
|
0.59
|
|
Serum Insulin (mIU/mL)
|
|
Raised
|
26
18.10 ± 7.08
[3.7 – 25.0]
|
34.66
|
30
19.03 ± 5.88
[4.2 – 25.0]
|
40.00
|
X2=0.29
t=0.53
|
0.30
|
|
Within normal limit
|
49
9.46 ± 3.40
[3.2 – 15.5]
|
65.33
|
45
8.27 ± 3.27
[3.2 – 14.5]
|
60.00
|
X2=0.17
t=1.70
|
0.05
|
|
Serum Luteinizing hormone LH
|
|
Beyond Normal
(10-20) mIU/mL
|
24
11.32 ± 2.02
[10.0 – 17.5]
|
32.00
|
18
11.51 ± 1.92
[10.0 –18.0]
|
24.00
|
X2= 0.86
t=0.30
|
0.38
|
|
Within Normal limit
(5-9.9) mIU/mL
|
51
7.60 ± 1.64
[5.1 – 9.8]
|
68.00
|
57
7.75 ± 1.31
[5.0 – 9.9]
|
76.00
|
X2=0.17
t=0.54
|
0.29
|
|
Serum Follicle Stimulating
Hormone (mIU/mL)
|
75
5.89 ± 1.36
[4.0 – 9.2]
|
100.00
|
75
5.74 ± 1.23
[4.0 – 9.5]
|
100.00
|
t=0.71
|
0.24
|
|
Serum Follicle Stimulating
Hormone
(mIU/mL)
(≤4.7)
|
11
4.15 ± 0.09
(4.0 - 4.2)
|
14.66
|
14
4.29±0.23
(4.0 - 4.7)
|
18.66
|
t=1.84
|
0.04
|
|
Serum FSH
(mIU/mL)
(≥4.8-21.5)
|
64
6.19± 1.55
(4.8 - 9.2)
|
85.33
|
61
6.07± 1.12
(4.8 - 9.5)
|
81.33
|
t=0.55
|
0.29
|
|
Ultrasonography
(Presence of ≥12 follicles)
|
45
|
60.00
|
59
|
78.66
|
1.88462
|
0.17
|
|
(Significant level calculated at
<0.05)
|
Discussion
During the
reproductive phase of women multiple
physiological, anatomical, and psychological
changes prevail [10,11,25]. The present
investigation has conducted a pilot study to
determine the magnitude of PCOS among reproductive
women residing in rural and urban areas of Assam,
Northeast India (Table 4). The study reported a
significantly higher proportion of the associated
symptoms of PCOS in the urban areas when compared
with the other counterparts to detect and evaluate
the risks for diagnosis. However, the prevalence
of PCOS depends upon the recruitment process, the
criteria used, and the applied methods [10,11,26].
A cross-sectional study conducted in Tamil Nadu,
India assessed young adolescents and found a
prevalence of 18.00% for PCOS [9] and concluded
that the proportion of PCOS cases was higher in
urban areas in comparison to rural areas. A study
was conducted among young women from a residential
college and found that 9.13% of them satisfied the
Rotterdam criteria for PCOS in Andhra Pradesh
[27]. Bharathi et al. reported the
prevalence of PCOS was 6.00% diagnosed by the
Rotterdam criteria in community-dwelling women
from rural and urban areas of Chennai [11].
International studies report that the prevalence
of PCOS is in the range of 4%-10% among women in
their reproductive age [28].
The PCOS symptoms of
hyperandrogenism, serum insulin resistance, and
recent weight gain were commonly observed among
the research participants and higher percentages
were observed in urban areas (Table 2 and 4).
Weight gain and body adiposity are strongly
associated with PCOS, and obesity is a well-known
factor to worsen the severity of this disorder
[29-31]. PCOS is an obesity-related condition, as
such weight gain and obesity contribute towards
the development of PCOS in women [29,31]. The
occurrence of obesity with PCOS which lead to
various cardiometabolic dysfunctions can make the
pathogenic pathways more challenging [31]. For
women who are diagnosed with PCOS, the metabolic
and hormonal conditions that are present such as
insulin resistance and hyperandrogenism may lead
to weight gain and eventually obesity [32]. A
study reported that the high percentages of women
with PCOS (50-90%) are insulin resistant [33] and
weight gain and obesity along with PCOS also
promote worsening insulin resistance [34]. The
effects of insulin in PCOS then likely contribute
towards the development of hyperandrogenemia which
also suppresses the sex-hormone-binding globulin
that enhances the androgenicity through increased
levels of free testosterone [31]. It is observed
that girls with high BMI in childhood had an
increased risk of oligomenorrhea and diagnosis of
PCOS in young adulthood [32,35].
The present study
has reported a higher prevalence of PCOS cases
within the age group of 24-29 years both in rural
and urban areas (Table 1). Several researchers
have reported that recent weight gain is the most
important symptom of menstrual disorders [9,10].
Menstrual disorders or simple oligomenorrhea might
serve as a marker of insulin resistance in
patients with PCOS, and insulin resistance may
induce oligo-or anovulation and thus menstrual
cycle irregularity which exacerbate
hyperandrogenemia by disrupting follicular growth
[36]. In a study conducted in Uttarakhand, the
most common symptom of PCOS was reported to be
menstrual irregularity which can otherwise be
called oligomenorrhea, and reported in 68% of the
women [9]. Another study has recorded even higher
estimates of oligomenorrhea at 97.6% in South
Indian adolescents aged 15-18 years [27]. A
systematic review and meta-analysis reported the
lowest rates of hirsutism and hyperandrogenemia in
Asian women [37]. The present study showed that
47.99% of the PCOS participants had hirsutism
(Table 4). Women with PCOS, develop hirsutism
gradually which intensifies with weight gain
(Table 2 and 3), and menstrual
irregularity like oligomenorrhea was frequently
associated with the rapid onset of hirsutism [6].
The present study
found that level of work activity is significantly
higher in rural areas as compared to urban areas
(Table 2). Diet on the other hand also influences
the heath of women. Better diet quality enhances
the reproductive health of the women. Diet
containing high amount of sugar, carbohydrates
starch, fat enhances the serum-insulin level and
becomes difficult to manage weight loss and in
turn affect the women with PCOS (Table 3) [38].
High fiber diet which mostly contain vegetables
can help to combat insulin resistance in the women
with PCOS by slowing down digestion and reducing
the effect of sugar on the blood. Sarkar et
al. [38] reported that lifestyle changes
have significantly influenced the prevalence of
PCOS. Lifestyle modification is a key component of
PCOS management and the evidence of higher obesity
and longitudinal weight gain, combined with high
rates in clinical lifestyle interventions suggests
that women with PCOS experience challenges with
weight management, implementing and sustaining
lifestyle changes [20,21,39]. Fasting serum
insulin is also found to be an independent
predictor of PCOS (Table 4) and Indian women with
PCOS reported higher fasting insulin levels [40].
However, PCOS is
often associated with raised insulin resistance as
well as with abnormal insulin secretion. These
abnormalities, along with obesity, substantially
increase the prevalence of glucose intolerance in
PCOS. The women are inherently insulin resistant
with compensatory hyperinsulinemia and play a
central role in the pathogenesis of PCOS [9,10].
Hyperinsulinemia probably increases the ovulation
and irregular menstrual cycle [9-11] and women
with PCOS have LH and FSH within the (5-20) mIU/ml
range [41], and the LH level is found to be higher
than that of FSH level causes due to hypothalamic
pituitary dysfunction or metabolic disorders
[41,42]. Hence, paying attention to early symptoms
like irregular menstrual cycles for over a year
along with the assessment of weight gain warrants
a visit to a gynecologist to facilitate early
diagnosis and treatment and to prevent
co-morbidities associated with PCOS [21,26,39].
Conclusion
The prevalence of
PCOS and its symptoms increase with age, which
emphasizes the need for a multidisciplinary
approach to identify the disorder at an early age
to prevent the occurrence of PCOS. The present
investigation concluded that the cause of PCOS
mainly emphasized menstrual irregularity and serum
insulin levels in association with lifestyle
conditions and their socio-economic background.
Further, a long-term personalized management
program is required for effectively treating
individuals with PCOS which can help regulate the
symptoms like menstrual irregularities,
dermatological issues like hirsutism, and acne,
improve fertility, lower the burden of obesity,
diabetes and various other metabolic complications
and the early steps is to first create awareness
and understanding of this disease in the
community.
Acknowledgements
The authors
gratefully acknowledged the help and active
cooperation of the participants and the medical
authority during the collection of data. The
extended cooperation and support of the Department
of Anthropology, Cotton University, is also
acknowledged.
References
- Azziz R, Dumesic DA, Goodarzi MO. Polycystic
ovary syndrome: An ancient disorder. FertilSteril.
2011; 95:1544-8.
- Panda PK, Rane R, Ravichandran R, et al.
Genetics of PCOS: A systematic
bioinformatics approach to unveil the proteins
responsible for PCOS. Genom Data.
2016; 8:52-60.
- Olefsky JM, Saltiel AR. PPAR gamma and the
treatment of insulin resistance. Trends
Endocrinol Metab. 2000;11:362-8. doi:
10.1016/s1043-2760(00)00306-4.
- Ganie MA, Vasudevan V, Rashid A. Epidemiology,
pathogenesis, genetics and management of
polycystic ovary syndrome in India. Indian
J Med Res.2019;150:333-34.
- Azziz R, Carmina E, Chen Z, et al.
Polycystic ovary syndrome. Nat Rev Dis Primers.
2016; 2:16057. doi: 10.1038/nrdp.2016.57.
- Mehreen TS, Ranjani H, Kamalesh R, et al.
Prevalence of polycystic ovarian syndrome among
adolescents and young women in India. J
Diabetol. 2021; 12:319-25.
- Soneja H. Prevalence of PCOS in India. PCOS
Statistics India. 2021.
- Deshwal R, Narwal V, Pundir CS. The Prevalence
of Polycystic Ovary Syndrome: Brief Systematic
Review. Journal ofHuman Reproductive
Sciences. 2020;13:261-271.
- Balaji S, Amadi C, Prasad S, et al.
Urban rural comparisons of polycystic ovary
syndrome burden among adolescent girls in a
hospital setting in India. Biomed Res Int.
2015;158951.
- Radha P, Devi RS, Madhavi J. Comparative study
of prevalence of polycystic ovarian syndrome in
rural and urban population. Adv Med Dent
Scie Res. 2016;4:90-95.
- Bharathi RV, Swetha S, Neeraja J, et al.
An epidemiological survey: Effect of
predisposing factors for PCOS in Indian urban
and rural population. Middle East Fertility
Society Journal. 2017; 22:313-316.
- Engman L, Susan J, Sun F, et al. Racial
and Ethnic Differences in the Polycystic Ovary
Syndrome (PCOS) Metabolic Phenotype. American
Journal of Obstetrics and Gynecology.
2018;216: 493.e1-493.e13.
- Sirmans S, Pate K. Epidemiology, diagnosis,
and management of polycystic ovary syndrome. Clinical
Epidemiology. 2014; 6:1-13.
- Chaudhari AP, Mazumdar K, Mehta PK. Anxiety,
Depression and Quality of Life in Women with
Polycystic Ovarian Syndrome. Indian Journal
of Psychological Medicine.
2018;40:239-246.
- Sadeeqa S, Mustafa T, Latif S. Polycystic
Ovarian Syndrome-Related Depression in
Adolescent Girls: A Review. Journal of
Pharmacy and Bioallied Sciences.
2018;10:55-59.
- Kakoly NS, Moran LJ, Teede HJ, et al.
Cardiometabolic risks in PCOS: a review of the
current state of knowledge. Exp Rev
Endocrinol Metab.2019;14:23-33.
- Kujanpaa L, Arffman RK, Pesonen P, et al.
Women with polycystic ovary syndrome are
burdened with multi-morbidity and medication use
independent of body mass index at late fertile
age: A population-based cohort study. Obstetrics
and Gynecology. 2022;101:728-736.
- Rotterdam ESHRE/ASRM-Sponsored PCOS consensus
workshop group. Revised 2003 consensus on
diagnostic criteria and long term health risks
related to polycystic ovary syndrome (PCOS). Hum
Reprod. 2004;19: 41-47.
- Wijeyaratne CN, Seneviratne RDA, Dahanayake S,
et al. Phenotype and metabolic profile
of South Asian women with polycystic ovary
syndrome (PCOS): results of a large database
from a specialist Endocrine Clinic. Human
Reproduction. 2011;26:202-213.
- Lim SS, Hutchinson SK, Van Ryswyk, et al.
Lifestyle changes in women with polycystic
ovary syndrome. Cochrane Database Syst Rev.
2019;3: Cd007506.
- Ee C, Pirotta S, Mousa A, et al.
Providing Lifestyle advice to women with PCOS:
an overview of practical issues affecting
success. BMC Endocrine Disorders.
2021; 21:234.
- Perla Health. The Rotterdam Criteria for
Diagnosing PCOS. Education. 2021;101.
- World Health Organization (WHO). Physical
status: the use of and interpretation of
anthropometry, report of a WHO expert committee.
WHO Technical Report Series. 1995;854.
- World Health Organization (WHO). Obesity:
Preventing and managing the global endemic. Report
of a WHO Consultation. World Health
Organization Technical Report, Series.
2000;894:1-253.
- Mukherjee A, Lama M, Shrestha S, et al. Perception
and practices of menstruation restrictions among
urban adolescent girls and women in Nepal: a
cross - sectional survey. Reproductive
Health. 2020;17(81). doi:
10.1186/s12978-020-00935-6.
- Joshi B, Mukherjee S, Patil A, et al. A
cross-sectional study of polycystic ovarian
syndrome among adolescent and young girls in
Mumbai. Indian J Endocrinol Metab.
2014; 18:317-24.
- Nidhi R, Padmalatha V, Nagarrathna R, et
al. Prevalence of Polycystic ovarian
syndrome in Indian adolescents. J Pediatr
Adolesc Gynecol. 2011; 24:223-7.
- Azziz R, Woods KS, Reyna R, et al. The
prevalence and features of polycystic ovary
syndrome in an unselected population. J
Clin Endocrinol Metab. 2004; 89:2745-9.
- Sam S. Obesity and Polycystic Ovary Syndrome.
Obesity management. 2010;3:69-73.
- Yildiz BO, Bozdog G, Yapici Z, et al. Prevalence,
phenotype and cardiometabolic risk of polycystic
ovary syndrome under different diagnostic
criteria. Hum Reprod. 2012;
27:3067-73.
- Barber TM, Hanson P, Weickert MO, et al.
Obesity and Polycystic Ovary syndrome:
Implications for Pathogenesis and Novel
Management Strategies. Clin Med Insights
Reprod Health.2019; 13:1179558119874042.
- Rosenberg SL. The Relationship Between PCOS
and Obesity: Which Comes First? The Science
Journal of the Lander College of Arts and
Sciences. 2019;13:34-40.
- Venkatesan AM, Dunaif A, Corbould A. Insulin
resistance in polycystic ovary syndrome:
progress and paradoxes. Recent Prog Horm
Res. 2001; 56:295-308.
- Barber TM, McCarthy MI, Wass JA, et al.
Obesity and Polycystic ovary syndrome. Clin
Endocrinol (Oxf). 2006; 65:137-145.
- Tian YE, Blizzard L, Oddy WH, et al. Associations
of childhood adiposity with menstrual
irregularity and polycystic ovary syndrome in
adulthood: The Childhood Determinants of Adult
Health Study and the Bogalusa Heart Study. Human
Reproduction. 2020; 35:1185-1198.
- Goodarzi MO, Dumesic DA, Chazenbalk G, et
al.Polycystic ovary syndrome: etiology,
pathogenesis and diagnosis. Nature Reviews.
Endocrinology. 2011; 7:219-231.
- Bozdag G, Mumusoglu S, Zengin D, et al. The
prevalence and phenotypic features of polycystic
ovary syndrome: A systematic review and
meta-analysis. Hum Reprod. 2016;
31:2841-55.
- Sarkar S, Das M, Mukhopadhyay, et al.
High prevalence of metabolic syndrome and its
correlates in two tribal populations of India
& the impact of urbanization. Indian J
Med Res 2006: 123;679-86.
- Teede HJ, Joham AE, Paul E, et al. Longitudinal
weight gain in women identified with Polycystic
Ovary Syndrome: results of an observational
study in young women. Obesity.
2013;21:1526-32.
- Vrbikova J, Cifkova R, Jirkovska A, et
al. Cardiovascular risk factors in young
Czech females with polycystic ovary syndrome. Hum
Reprod. 2003; 18:980-4.
- Sterling E. Hormone Levels and PCOS. Contemporary
OB/GYN. 2011.
- Li Y, Wei LN, Xiong YL, et al.
Effect of luteinizing hormone vs follicular
stimulating hormone ratio on anti-Müllerian
hormone secretion and folliculogenesis in
patients with polycystic ovarian syndrome. Zhonghua
Fu Chan Ke Za Zhi. 2010; 45:567-70.
|


