|
Abbreviations
CVD = cardiovascular disease
HDL-C = high-density lipoprotein
LDL-C = low-density lipoprotein
NHANES = National Health and Nutrition
Examination Survey
TC = total cholesterol
TC/HDL-C ratio = total cholesterol-to-high
density lipoprotein cholesterol ratio
TG = triglyceride
Introduction:
Atherosclerotic
cardiovascular disease (e.g., coronary heart
disease, stroke, peripheral arterial disease) is
the leading cause of morbidity and mortality
globally, taking an estimated 17.9 million lives
each year. Because of the burden of CVD and the
cost to the healthcare system, population-wide
prevention of coronary heart disease has included
guidelines intended to reduce the risk of getting
CVD.1–4 Since 1980, the American
College of Cardiology (ACC) and American Heart
Association (AHA) have translated scientific
evidence into clinical practice guidelines and
recommendations for CVD risk reduction.1,5
In 2014, the Department of Veterans Affairs (VA)
and the Department of Defense (DoD) approved a
joint clinical practice guideline for managing
dyslipidemia to improve cardiovascular health.3
Risk models, such as
the ASCVD Risk Estimator Plus, are used to
estimate a person’s current 10-year CVD risk,
forecast the potential impact of interventions,
and help with the clinician-patient discussion.
The risk threshold is used to initiate discussion
for statin therapy for primary prevention. The
importance of adherence to a healthy lifestyle has
been recommended in the past few decades to lower
the risk of CVDs such as getting more exercise,
eating a healthy diet, limiting alcohol intake,
stopping smoking, and losing excess body weight.
Additionally, routine lipid monitoring (e.g.,
Coronary Risk Profile) or lipid panel measurements
are used to monitor cardiovascular health and
assess efficacy of therapy.
Among the CVD risk
factors, dyslipidemia is recognized as one of the
main metabolic risk factors of major CVDs and is
amenable to risk-modifying preventions.
Specifically, low levels of high-density
lipoprotein cholesterol (HDL-C), and elevated
total cholesterol (TC), triglycerides (TG),
non-HDL-C, and low-density lipoprotein cholesterol
(LDL-C) are considered strong independent risk
factors for CVD. While reduction of the LDL-C
level is the primary target for statin therapy,
the serum total cholesterol-to-high density
lipoprotein cholesterol (TC/HDL-C) ratio has been
used in many clinical trials as outcome measures
to assess the effect of nutrient consumptions and
lipid profile improvement training programs. The
lipid ratio has been used as outcome measures in
heart disease studies,6 and as
secondary goal of therapy by the Canadian Working
Group on Hypercholesterolemia and Other
Dyslipidemias.7 Also known as the
atherogenic or Castelli index, the TC/HDL-C ratio
is one of the important biomarkers of
cardio-metabolic health and indicators of vascular
risk.8,9 Since the lipid metabolism
involves endogenous and exogenous pathways and
interplays among lipoproteins, lipid ratios may
serve as cost-effective markers to monitor
abnormalities in lipoprotein metabolism and
various disorders and provide insight into current
and future cardiovascular health and inform public
health efforts.
Reliable and
disaggregated population-based data for
cholesterol trends are needed to evaluate overall
cardiovascular health, assess the effects of
nutritional policies and pharmacological
interventions, and guide priority setting.10
In prior analyses of lipid levels, trends of
various lipid panel measurements were described in
U.S.11–16 and various countries.17–26
It is not known if lipid panel components
differentially affect individuals with diverse
race/ethnicity background. The purpose of this
study was to examine the latest trends in serum
TC/HDL-C ratio levels across the life span (6 to
80 years old) in noninstitutionalized U.S.
residents in four distinct cross-sectional surveys
during 2005-2008, 2009-2012, 2013-2016, and
2017-2020 and compare the ratio trends by
race/ethnicity. Data for trends in serum
cholesterol provide insight into current and
future cardiovascular health and inform public
health efforts.
Methods:
Study Design
This was an
observational cross-sectional study. We used data
from the National Health and Nutrition Examination
Survey (NHANES), which is a major program of the
National Center for Health Statistics (NCHS), part
of the Centers for Disease Control and Prevention
(CDC). NHANES includes nationally representative,
complex, multistage, probability samples of the
U.S. residents, noninstitutionalized population.
Participants in NHANES received a detailed
in-person home interview followed by physical
assessments, including laboratory measures at a
mobile examination center. A phlebotomist assessed
the participant's fasting status before the blood
draw. As part of the laboratory evaluation, serum
TC and HDL-C levels were measured in participants
aged 6 years and older and fasting TGs were
measured in participants aged 12 years and older.
Laboratory Measurements
Samples were
received frozen and stored at -80ºC in the freezer
until testing was performed. Upon completion of
the analysis, specimens were stored at -70ºC and
discarded after 1 year. All lipid analyses were
analyzed according to a standardized protocol and
can be found on the NHANES website
(https://wwwn.cdc.gov/nchs/nhanes). Through the
past decade, there were no major changes to the
laboratory methods. The blood specimen was
analyzed using the Roche/Hitachi Cobas 6000
chemistry analyzer in recent years. However, the
TC, HDL-C, and TGs were measured on the Roche
modular P chemistry analyzer in the 2011-2012
cycle, and were measured on the Roche modular P
and Roche Cobas 6000 chemistry analyzers in the
2013-2014 cycle.
NHANES 2005-2020 Data
NHANES data has
since been released in two-year cycles. Data from
nine NHANES data cycles were included in the
analysis, including 2005-2006, 2007-2008,
2009-2010, 2011-2012, 2013-2014, 2015-2016,
2017-2020 (pre-pandemic data). Of the initial
76,496 data records, 13,253 participants were
removed because they were younger than 6 years old
(no blood test). Additional 8,609 participants
were removed because they did not have either TC
or HDL-C values. Because we observed some extreme
lipoprotein values (e.g., TC/HDL-C > 25
while most of the data had a median TC/HDL-C value
smaller than 5.0), we flagged participants with
extreme values while comparing with sex- and age
group-matched samples. As a result, additional 670
participants were classified as outliers and
removed, resulting in a total sample of 53,964 for
subsequent analysis.
Written informed
consent was obtained from participants aged 12
years and older and written child assent was
obtained from those aged 7 to11 years. Approval
for use of the NHANES data for this study was
provided by the NCHS Research Ethics Review Board.
Because this study involved secondary analysis of
de-identified data, the Institutional Review
Boards of the University of Wisconsin - Milwaukee
determined that this study did not fall within the
regulatory definition of research involving human
subjects and did not require further IRB review.
Demographic Variables
Age in years was
reported for survey participants at the time of
the screening interview. Because the age of 80 and
older was determined to be a disclosure risk, all
participants aged 80 years and older were coded as
'80' by the NHANES. In this study, age was
categorized as 6-8, 9-11 (children), 12-15, 16-19
(adolescent), 20-24, 25-29, 30-34, 35-39, 40-44,
45-49, 50-54, 55-59, 60-64, 65-69, 70-74, 75-79,
and 80+ (adult) years. Based on the analytical
guidelines, each 2-year cycle, and any combination
of 2-year cycles is a nationally representative
sample. We categorized data into four distinct
cross-sectional survey periods during 2005-2008,
2009-2012, 2013-2016, and 2017-2020.
Race/ethnicity variable included Mexican American,
other Hispanic, non-Hispanic white, non-Hispanic
black, and other race - including multi-racial.
Cholesterol Ratio
The TC/HDL-C ratio
was calculated by dividing the TC by HDL-C level.
In general, higher levels of TC and lower levels
of HDL-C increases risk of CVD. Therefore, The
higher the ratio, the higher the risk. A TC/HDL-C
ratio below 6, below 5, and below 4 is recommended
for people at low, moderate, and high risk for CVD
management.2
Statistical Analyses
We described the
distributions of TC/HDL-C ratio across the life
span 6-80+ by sex, examined the ratio trends
between four survey periods, and compared the
ratio levels by race/ethnicity. Descriptive
statistics (including the mean and confidence
interval) of the TC/HDL-C, lipoprotein ratio was
tabulated for relevant strata. Box plots and line
graphs were used to display mean TC/HDL-C values
by age.
To compare
lipoprotein ratio measures, a 2 (sex: male vs
female) x 4 (survey periods) x 17 (age group)
general linear model (GLM) analysis was used to
test the hypothesis that these independent
variables should be used to stratify lipoprotein
ratio measurements. Hypotheses of no survey trends
in lipoprotein ratio values over the four survey
periods were tested. For independent variables
found to have a significant main or interactive
effect on lipid measurements, Scheffe pairwise
post-hoc comparisons were conducted. The
significant level was set at alpha = 0.05. All
analyses were performed using the SPSS Statistics
for Windows, Version 28.0. (Armonk, NY: IBM Corp).
Results
Analytic
Sample
The final data for
analysis included 53,964 participants aged 6 to
80+ years old. Among them, 50.7% of the sample
were females. The majority of the sample was
non-Hispanic white (37.6%), followed by
non-Hispanic black (22.7%), Mexican American
(18.3%), other Hispanic (9.9%), and others
including multi-racial (11.5%).
Overall GLM
Cholesterol ratios
changed by age and differed by sex. The main
effects (sex, age group, survey period,
race/ethnicity) were significant (p<0.001).
Subsequently, to assist in clinical interpretation
of lipoprotein ratios, we summarized ratio
measures by sex and age group. The linear trend of
the survey years was tested for each age group.
The differences in ratio levels were compared
between race/ethnicity after stratifying by sex
and age group.
TC/HDL-C Ratio
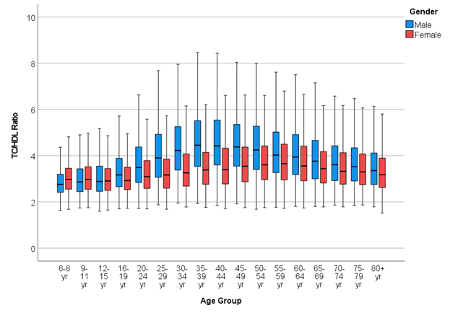
Figure 1 presents
the box plot of the TC/HDL-C ratio by sex. The
means of TC/HDL-C ratio were lower for younger
children, gradually increased to reach a plateau
in the adult life, peaked around 40-44 years old
for males and 55-59 years old for females, and
then gradually declined onwards. Males had a
higher TC/HDL-C ratio than females in most age
groups (p<0.01), except girls had higher lipid
ratio levels than boys in the age group 6-8, 9-11
(p<0.001), and there
were no differences between the sexes from
age 12 to 15 (p=0.135).
|
| Figure 1: Box plot of the
TC/HDL-C ratio by sex |
|
Table 1: Means and 95% confidence
intervals of the TC/HDL-C ratio, aged 6
to 80+ years, 2005-2020, by survey
period
|
|
NHANES 2005-2008 (a)
|
NHANES 2009-2012 (b)
|
NHANES 2013-2016 (c)
|
NHANES 2017-2020 (d)
|
p-value for linear trend
|
|
Age
|
|
|
95% CI
|
|
|
95% CI
|
|
|
95% CI
|
|
|
95% CI
|
|
a
|
a
|
b
|
|
Male
|
N
|
M
|
L
|
U
|
N
|
M
|
L
|
U
|
N
|
M
|
L
|
U
|
N
|
M
|
L
|
U
|
Overall
|
to c
|
to d
|
to d
|
|
6-8
|
447
|
2.91
|
2.81
|
3.01
|
506
|
2.93
|
2.83
|
3.02
|
522
|
2.79
|
2.70
|
2.89
|
300
|
2.81
|
2.69
|
2.92
|
**
|
-
|
-
|
-
|
|
9-11
|
483
|
3.08
|
2.98
|
3.18
|
480
|
3.11
|
3.01
|
3.21
|
509
|
2.94
|
2.84
|
3.04
|
346
|
2.94
|
2.83
|
3.05
|
***
|
-
|
-
|
*
|
|
12-15
|
758
|
3.17
|
3.09
|
3.25
|
586
|
3.06
|
2.97
|
3.15
|
632
|
3.04
|
2.95
|
3.12
|
426
|
3.04
|
2.94
|
3.14
|
*
|
-
|
-
|
-
|
|
16-19
|
785
|
3.37
|
3.29
|
3.45
|
601
|
3.47
|
3.38
|
3.56
|
552
|
3.28
|
3.18
|
3.37
|
407
|
3.35
|
3.25
|
3.46
|
**
|
-
|
-
|
-
|
|
20-24
|
378
|
3.76
|
3.65
|
3.88
|
483
|
3.76
|
3.66
|
3.86
|
414
|
3.64
|
3.53
|
3.74
|
282
|
3.68
|
3.56
|
3.80
|
-
|
-
|
-
|
-
|
|
25-29
|
301
|
4.36
|
4.23
|
4.49
|
313
|
4.21
|
4.09
|
4.34
|
320
|
3.97
|
3.85
|
4.10
|
213
|
3.81
|
3.67
|
3.95
|
***
|
**
|
***
|
*
|
|
30-34
|
367
|
4.43
|
4.32
|
4.55
|
436
|
4.48
|
4.37
|
4.58
|
454
|
4.53
|
4.42
|
4.63
|
287
|
4.27
|
4.15
|
4.39
|
-
|
-
|
-
|
-
|
|
35-39
|
425
|
4.73
|
4.62
|
4.84
|
434
|
4.73
|
4.62
|
4.84
|
395
|
4.69
|
4.58
|
4.81
|
248
|
4.37
|
4.24
|
4.50
|
*
|
-
|
*
|
*
|
|
40-44
|
385
|
4.77
|
4.66
|
4.88
|
436
|
4.69
|
4.59
|
4.80
|
408
|
4.57
|
4.46
|
4.68
|
297
|
4.42
|
4.30
|
4.54
|
**
|
-
|
*
|
-
|
|
45-49
|
394
|
4.54
|
4.43
|
4.65
|
428
|
4.71
|
4.61
|
4.82
|
411
|
4.51
|
4.40
|
4.62
|
307
|
4.39
|
4.27
|
4.50
|
*
|
-
|
-
|
*
|
|
50-54
|
433
|
4.60
|
4.49
|
4.70
|
454
|
4.61
|
4.51
|
4.72
|
420
|
4.36
|
4.26
|
4.47
|
306
|
4.22
|
4.10
|
4.33
|
***
|
-
|
**
|
**
|
|
55-59
|
290
|
4.47
|
4.34
|
4.60
|
387
|
4.24
|
4.13
|
4.36
|
398
|
4.29
|
4.18
|
4.40
|
320
|
4.02
|
3.91
|
4.14
|
***
|
-
|
***
|
-
|
|
60-64
|
434
|
4.30
|
4.19
|
4.40
|
476
|
4.29
|
4.19
|
4.39
|
482
|
4.17
|
4.07
|
4.27
|
454
|
3.89
|
3.79
|
3.98
|
***
|
-
|
***
|
***
|
|
65-69
|
330
|
4.05
|
3.93
|
4.18
|
368
|
4.01
|
3.90
|
4.13
|
357
|
3.87
|
3.75
|
3.98
|
320
|
3.76
|
3.64
|
3.87
|
**
|
-
|
*
|
-
|
|
70-74
|
308
|
3.98
|
3.85
|
4.10
|
296
|
3.89
|
3.76
|
4.02
|
297
|
3.76
|
3.63
|
3.89
|
269
|
3.49
|
3.36
|
3.61
|
***
|
-
|
***
|
***
|
|
75-79
|
254
|
3.89
|
3.76
|
4.03
|
220
|
3.67
|
3.52
|
3.82
|
198
|
3.55
|
3.39
|
3.71
|
162
|
3.55
|
3.39
|
3.71
|
***
|
**
|
*
|
-
|
|
80+
|
331
|
3.64
|
3.52
|
3.76
|
320
|
3.56
|
3.43
|
3.68
|
293
|
3.53
|
3.40
|
3.66
|
265
|
3.33
|
3.21
|
3.46
|
**
|
-
|
**
|
-
|
|
Total
|
7103
|
3.90
|
|
|
7224
|
3.93
|
|
|
7062
|
3.81
|
|
|
5209
|
3.70
|
|
|
|
|
|
|
|
Female
|
N
|
M
|
L
|
U
|
N
|
M
|
L
|
U
|
N
|
M
|
L
|
U
|
N
|
M
|
L
|
U
|
|
|
|
|
|
6-8
|
439
|
3.15
|
3.04
|
3.25
|
433
|
3.16
|
3.05
|
3.27
|
472
|
2.99
|
2.89
|
3.10
|
281
|
2.98
|
2.86
|
3.10
|
***
|
*
|
*
|
*
|
|
9-11
|
497
|
3.17
|
3.07
|
3.26
|
511
|
3.19
|
3.09
|
3.29
|
511
|
3.02
|
2.93
|
3.12
|
362
|
3.01
|
2.90
|
3.12
|
***
|
*
|
*
|
**
|
|
12-15
|
723
|
3.11
|
3.03
|
3.19
|
525
|
3.07
|
2.97
|
3.16
|
565
|
3.00
|
2.90
|
3.09
|
369
|
2.96
|
2.86
|
3.07
|
**
|
-
|
*
|
-
|
|
16-19
|
743
|
3.09
|
3.01
|
3.17
|
546
|
3.11
|
3.02
|
3.21
|
576
|
3.09
|
3.00
|
3.18
|
394
|
3.11
|
3.00
|
3.21
|
-
|
-
|
-
|
-
|
|
20-24
|
480
|
3.40
|
3.30
|
3.50
|
493
|
3.27
|
3.17
|
3.37
|
426
|
3.27
|
3.16
|
3.38
|
288
|
3.15
|
3.03
|
3.27
|
**
|
-
|
**
|
-
|
|
25-29
|
375
|
3.46
|
3.35
|
3.58
|
358
|
3.46
|
3.35
|
3.58
|
365
|
3.24
|
3.12
|
3.36
|
253
|
3.19
|
3.07
|
3.32
|
***
|
*
|
*
|
*
|
|
30-34
|
442
|
3.55
|
3.45
|
3.66
|
470
|
3.60
|
3.49
|
3.70
|
465
|
3.46
|
3.36
|
3.57
|
336
|
3.32
|
3.21
|
3.43
|
**
|
-
|
*
|
**
|
|
35-39
|
414
|
3.60
|
3.49
|
3.71
|
464
|
3.66
|
3.55
|
3.76
|
458
|
3.52
|
3.41
|
3.62
|
332
|
3.52
|
3.40
|
3.63
|
-
|
-
|
-
|
-
|
|
40-44
|
423
|
3.64
|
3.53
|
3.74
|
497
|
3.79
|
3.69
|
3.89
|
526
|
3.55
|
3.45
|
3.65
|
329
|
3.58
|
3.46
|
3.69
|
**
|
-
|
-
|
-
|
|
45-49
|
421
|
3.71
|
3.60
|
3.81
|
477
|
3.81
|
3.71
|
3.91
|
466
|
3.80
|
3.70
|
3.91
|
313
|
3.63
|
3.51
|
3.75
|
-
|
-
|
-
|
-
|
|
50-54
|
393
|
3.93
|
3.82
|
4.04
|
465
|
3.80
|
3.70
|
3.91
|
460
|
3.71
|
3.61
|
3.81
|
332
|
3.67
|
3.56
|
3.78
|
**
|
-
|
*
|
-
|
|
55-59
|
323
|
4.00
|
3.88
|
4.13
|
358
|
3.91
|
3.80
|
4.03
|
413
|
3.73
|
3.62
|
3.84
|
393
|
3.68
|
3.58
|
3.78
|
***
|
*
|
**
|
-
|
|
60-64
|
445
|
3.88
|
3.78
|
3.98
|
511
|
3.87
|
3.77
|
3.97
|
483
|
3.66
|
3.56
|
3.76
|
426
|
3.59
|
3.49
|
3.69
|
***
|
*
|
**
|
**
|
|
65-69
|
308
|
3.74
|
3.62
|
3.87
|
316
|
3.81
|
3.68
|
3.93
|
401
|
3.58
|
3.47
|
3.69
|
310
|
3.44
|
3.32
|
3.56
|
***
|
-
|
**
|
***
|
|
70-74
|
302
|
3.66
|
3.53
|
3.79
|
325
|
3.53
|
3.41
|
3.66
|
309
|
3.56
|
3.43
|
3.68
|
241
|
3.43
|
3.30
|
3.56
|
-
|
-
|
-
|
-
|
|
75-79
|
216
|
3.65
|
3.50
|
3.80
|
201
|
3.54
|
3.38
|
3.70
|
195
|
3.41
|
3.25
|
3.57
|
155
|
3.39
|
3.23
|
3.56
|
*
|
-
|
-
|
-
|
|
80+
|
339
|
3.54
|
3.42
|
3.66
|
333
|
3.47
|
3.35
|
3.59
|
334
|
3.27
|
3.15
|
3.39
|
261
|
3.17
|
3.04
|
3.29
|
***
|
**
|
***
|
**
|
|
Total
|
7283
|
3.49
|
|
|
7283
|
3.52
|
|
|
7425
|
3.39
|
|
|
5375
|
3.35
|
|
|
|
|
|
|
|
Abbreviations: TC = total cholesterol;
HDL = high-density lipoprotein; M = mean;
N = number of participants; CI =
confidence interval; U = 95% CI upper
limit; L = 95% CI lower limit.
Note. “-” indicates of p > 0.05; *
indicates p ≤ 0.05; ** means p ≤ 0.01; ***
means p ≤ 0.001. Because the differences
between survey period 2005-2008 (a) and
2009-2012 (b) were not significant for all
pairwise comparisons, results were not
listed. Similarly, the differences between
survey period 2013-2016 (c) and 2017-2020
(d) were not significant for most pairwise
comparisons except two age groups (60-64,
70-74) in males, results were not listed.
|
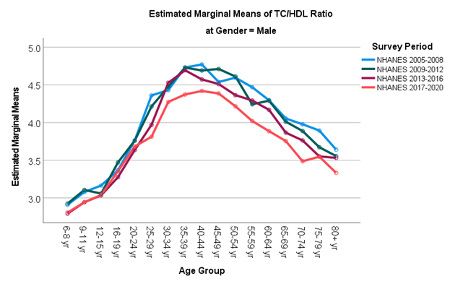
Table 1 summarizes
means and 95% confidence intervals of the TC/HDL-C
ratio by survey period (2005-2008, 2009-2012,
2013-2016, and 2017-2020). In youth aged <20
years, mean TC/HDL-C ratios were 3.17, 3.15, 3.02,
and 3.06 in males; and 3.12, 3.13, 3.03, and 3.02
in females from 2005 to 2020 (linear trend
p<0.001). In adults 20 years old and older,
mean TC/HDL-C ratios declined from 4.30 in
2005-2008, to 4.27 in 2009-2012, 4.17 in
2013-2016, to 3.96 in 2017-2020 in males; while
mean TC/HDL-C ratios declined from 3.67 in
2005-2008, to 3.67 in 2009-2012, to 3.54 in
2013-2016, to 3.47 in 2017-2020 in females (linear
trend p<0.001). In the subsequent pairwise
comparisons, there were no significant differences
between adjacent survey periods 2005-2008 and
2009-2012, as well as most of the comparisons
between survey periods 2013-2016 and 2017-2020.
Significant changes were observed between survey
periods 2005-2008 and 2017-2020, and between
2009-2012 and 2017-2020. Figure 2 illustrates line
graphs of the TC/HDL-C ratio by survey period.
 |
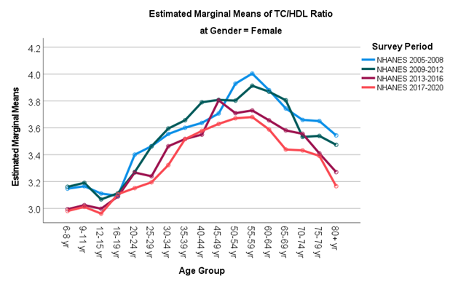 |
| Figure 2: Line graphs of the
TC/HDL-C ratio by survey period |
|
Table 2: Means and 95% confidence
intervals of the TC/HDL-C ratio, aged 6
to 80+ years, 2005-2020, by
race/ethnicity
|
|
Mexican American
|
|
Other Hispanic
|
White
|
|
|
|
Black
|
|
|
|
Other Race
|
|
|
p-value
|
|
|
|
95% CI
|
|
|
95% CI
|
|
|
95% CI
|
|
|
95% CI
|
|
|
95% CI
|
|
|
Male
|
N
|
M
|
L
|
U
|
N
|
M
|
L
|
U
|
N
|
M
|
L
|
U
|
N
|
M
|
L
|
U
|
N
|
M
|
L
|
U
|
Overall
|
|
6-8
|
423
|
2.93
|
2.82
|
3.04
|
204
|
2.98
|
2.83
|
3.13
|
518
|
2.90
|
2.80
|
3.00
|
428
|
2.70
|
2.61
|
2.80
|
202
|
2.84
|
2.69
|
2.99
|
***
|
|
9-11
|
457
|
3.18
|
3.08
|
3.29
|
198
|
3.13
|
2.97
|
3.28
|
496
|
3.01
|
2.91
|
3.11
|
449
|
2.83
|
2.74
|
2.93
|
218
|
3.00
|
2.86
|
3.14
|
***
|
|
12-15
|
557
|
3.19
|
3.10
|
3.29
|
241
|
3.20
|
3.06
|
3.34
|
702
|
3.17
|
3.09
|
3.26
|
613
|
2.84
|
2.76
|
2.92
|
289
|
3.06
|
2.93
|
3.18
|
***
|
|
16-19
|
562
|
3.49
|
3.40
|
3.58
|
194
|
3.47
|
3.31
|
3.63
|
674
|
3.45
|
3.36
|
3.53
|
632
|
3.18
|
3.10
|
3.26
|
283
|
3.31
|
3.18
|
3.44
|
***
|
|
20-24
|
293
|
3.97
|
3.85
|
4.10
|
157
|
3.92
|
3.75
|
4.10
|
537
|
3.78
|
3.69
|
3.88
|
358
|
3.33
|
3.23
|
3.43
|
212
|
3.68
|
3.53
|
3.82
|
***
|
|
25-29
|
248
|
4.53
|
4.39
|
4.67
|
101
|
4.25
|
4.03
|
4.46
|
394
|
4.10
|
3.98
|
4.21
|
240
|
3.69
|
3.56
|
3.82
|
164
|
4.03
|
3.87
|
4.20
|
***
|
|
30-34
|
226
|
4.71
|
4.57
|
4.86
|
156
|
4.60
|
4.43
|
4.77
|
656
|
4.50
|
4.41
|
4.59
|
288
|
4.06
|
3.94
|
4.17
|
218
|
4.39
|
4.24
|
4.53
|
***
|
|
35-39
|
291
|
5.04
|
4.91
|
5.16
|
136
|
4.82
|
4.64
|
5.01
|
610
|
4.62
|
4.53
|
4.71
|
265
|
4.26
|
4.14
|
4.38
|
200
|
4.68
|
4.53
|
4.83
|
***
|
|
40-44
|
285
|
4.85
|
4.72
|
4.98
|
157
|
4.98
|
4.81
|
5.16
|
575
|
4.75
|
4.65
|
4.84
|
303
|
4.00
|
3.89
|
4.12
|
206
|
4.63
|
4.49
|
4.78
|
***
|
|
45-49
|
228
|
4.76
|
4.62
|
4.91
|
130
|
4.79
|
4.60
|
4.98
|
636
|
4.63
|
4.54
|
4.72
|
337
|
4.09
|
3.98
|
4.19
|
209
|
4.68
|
4.53
|
4.82
|
***
|
|
50-54
|
266
|
4.76
|
4.62
|
4.89
|
165
|
4.77
|
4.60
|
4.94
|
629
|
4.52
|
4.43
|
4.61
|
353
|
4.01
|
3.90
|
4.11
|
200
|
4.50
|
4.35
|
4.65
|
***
|
|
55-59
|
181
|
4.70
|
4.54
|
4.87
|
126
|
4.60
|
4.41
|
4.79
|
591
|
4.28
|
4.18
|
4.37
|
315
|
3.79
|
3.68
|
3.90
|
182
|
4.30
|
4.14
|
4.45
|
***
|
|
60-64
|
318
|
4.53
|
4.41
|
4.65
|
224
|
4.52
|
4.37
|
4.66
|
626
|
4.18
|
4.09
|
4.27
|
518
|
3.78
|
3.69
|
3.87
|
160
|
4.09
|
3.92
|
4.26
|
***
|
|
65-69
|
194
|
4.27
|
4.11
|
4.42
|
152
|
3.99
|
3.81
|
4.16
|
509
|
3.97
|
3.87
|
4.07
|
385
|
3.70
|
3.60
|
3.80
|
135
|
3.83
|
3.65
|
4.01
|
***
|
|
70-74
|
115
|
3.86
|
3.66
|
4.06
|
91
|
3.90
|
3.67
|
4.13
|
657
|
3.88
|
3.79
|
3.97
|
205
|
3.44
|
3.31
|
3.58
|
102
|
3.69
|
3.48
|
3.90
|
***
|
|
75-79
|
82
|
3.75
|
3.51
|
3.99
|
40
|
3.64
|
3.29
|
3.98
|
496
|
3.78
|
3.68
|
3.88
|
158
|
3.47
|
3.32
|
3.63
|
58
|
3.40
|
3.12
|
3.68
|
**
|
|
80+
|
55
|
3.66
|
3.37
|
3.96
|
41
|
3.70
|
3.35
|
4.04
|
928
|
3.54
|
3.47
|
3.62
|
122
|
3.21
|
3.03
|
3.39
|
63
|
3.63
|
3.36
|
3.89
|
**
|
|
Total
|
4781
|
3.99
|
|
|
2513
|
4.03
|
|
|
10234
|
3.94
|
|
|
5969
|
3.48
|
|
|
3101
|
3.86
|
|
|
|
|
Female
|
N
|
M
|
L
|
U
|
N
|
M
|
L
|
U
|
N
|
M
|
L
|
U
|
N
|
M
|
L
|
U
|
N
|
M
|
L
|
U
|
|
|
6-8
|
420
|
3.19
|
3.08
|
3.29
|
172
|
3.19
|
3.03
|
3.36
|
419
|
3.10
|
2.99
|
3.21
|
412
|
2.87
|
2.78
|
2.97
|
202
|
3.13
|
2.98
|
3.28
|
***
|
|
9-11
|
498
|
3.14
|
3.04
|
3.23
|
180
|
3.20
|
3.04
|
3.37
|
503
|
3.20
|
3.10
|
3.30
|
487
|
2.95
|
2.86
|
3.04
|
213
|
3.08
|
2.94
|
3.23
|
***
|
|
12-15
|
574
|
3.08
|
2.99
|
3.17
|
222
|
3.13
|
2.99
|
3.28
|
577
|
3.13
|
3.04
|
3.22
|
566
|
2.93
|
2.84
|
3.01
|
243
|
2.96
|
2.83
|
3.10
|
***
|
|
16-19
|
553
|
3.15
|
3.06
|
3.25
|
224
|
3.05
|
2.91
|
3.20
|
619
|
3.20
|
3.10
|
3.29
|
589
|
2.97
|
2.88
|
3.05
|
274
|
3.10
|
2.98
|
3.23
|
***
|
|
20-24
|
328
|
3.47
|
3.35
|
3.59
|
186
|
3.34
|
3.18
|
3.50
|
588
|
3.33
|
3.23
|
3.42
|
404
|
3.14
|
3.05
|
3.24
|
181
|
3.09
|
2.93
|
3.25
|
***
|
|
25-29
|
256
|
3.54
|
3.40
|
3.68
|
140
|
3.23
|
3.04
|
3.41
|
473
|
3.43
|
3.32
|
3.53
|
296
|
3.21
|
3.09
|
3.32
|
186
|
3.23
|
3.08
|
3.39
|
***
|
|
30-34
|
294
|
3.69
|
3.57
|
3.82
|
176
|
3.59
|
3.43
|
3.76
|
626
|
3.57
|
3.48
|
3.66
|
376
|
3.25
|
3.15
|
3.36
|
241
|
3.35
|
3.22
|
3.49
|
***
|
|
35-39
|
296
|
3.83
|
3.70
|
3.96
|
168
|
3.47
|
3.30
|
3.64
|
653
|
3.58
|
3.49
|
3.67
|
317
|
3.37
|
3.26
|
3.48
|
234
|
3.60
|
3.46
|
3.74
|
***
|
|
40-44
|
337
|
3.87
|
3.75
|
3.99
|
178
|
3.76
|
3.60
|
3.92
|
614
|
3.68
|
3.59
|
3.77
|
399
|
3.43
|
3.33
|
3.52
|
247
|
3.52
|
3.38
|
3.65
|
***
|
|
45-49
|
261
|
3.96
|
3.83
|
4.10
|
161
|
3.95
|
3.78
|
4.12
|
668
|
3.78
|
3.69
|
3.86
|
384
|
3.52
|
3.42
|
3.63
|
203
|
3.65
|
3.50
|
3.80
|
***
|
|
50-54
|
255
|
3.99
|
3.86
|
4.13
|
208
|
3.89
|
3.74
|
4.04
|
600
|
3.82
|
3.72
|
3.91
|
387
|
3.59
|
3.49
|
3.69
|
200
|
3.66
|
3.51
|
3.81
|
***
|
|
55-59
|
199
|
4.16
|
4.01
|
4.32
|
157
|
4.07
|
3.90
|
4.25
|
589
|
3.79
|
3.70
|
3.89
|
362
|
3.67
|
3.56
|
3.77
|
180
|
3.63
|
3.47
|
3.79
|
***
|
|
60-64
|
329
|
3.97
|
3.85
|
4.09
|
245
|
3.92
|
3.78
|
4.06
|
615
|
3.78
|
3.69
|
3.87
|
495
|
3.54
|
3.45
|
3.62
|
181
|
3.64
|
3.49
|
3.80
|
***
|
|
65-69
|
198
|
3.82
|
3.67
|
3.98
|
178
|
3.93
|
3.77
|
4.09
|
539
|
3.65
|
3.56
|
3.75
|
298
|
3.38
|
3.26
|
3.49
|
122
|
3.49
|
3.29
|
3.68
|
***
|
|
70-74
|
132
|
3.64
|
3.45
|
3.83
|
117
|
3.77
|
3.57
|
3.97
|
618
|
3.58
|
3.49
|
3.67
|
211
|
3.39
|
3.26
|
3.53
|
99
|
3.34
|
3.13
|
3.55
|
**
|
|
75-79
|
68
|
3.67
|
3.40
|
3.93
|
65
|
3.65
|
3.37
|
3.92
|
436
|
3.54
|
3.44
|
3.65
|
142
|
3.25
|
3.09
|
3.42
|
56
|
3.52
|
3.23
|
3.80
|
*
|
|
80+
|
72
|
3.33
|
3.08
|
3.59
|
62
|
3.61
|
3.33
|
3.88
|
917
|
3.40
|
3.32
|
3.47
|
152
|
3.12
|
2.96
|
3.28
|
64
|
3.49
|
3.23
|
3.76
|
**
|
|
Total
|
5070
|
3.53
|
|
|
2839
|
3.56
|
|
|
10054
|
3.51
|
|
|
6277
|
3.25
|
|
|
3126
|
3.36
|
|
|
|
|
Abbreviations: TC = total cholesterol;
HDL = high-density lipoprotein; M = mean;
N = number of participants; CI =
confidence interval; U = 95% CI upper
limit; L = 95% CI lower limit.
Note: * indicates p ≤ 0.05; ** means p ≤
0.01; *** means p ≤ 0.001.
|
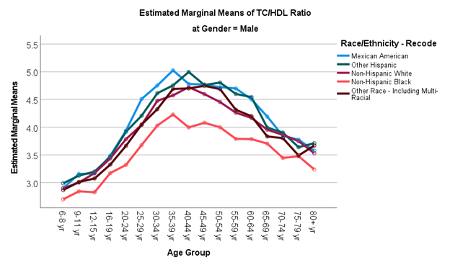
Table 2 summarizes
means and 95% confidence intervals of the TC/HDL-C
ratio by race/ethnicity. Overall, non-Hispanic
black individuals tended to have lower mean TC/HDL
ratio levels compared to other race/ethnic groups
on average, while Mexican American individuals
tended to have higher TC/HDL ratio levels. The
follow-up pairwise comparisons were significant
for each age group (all p<0.05). The
differences between Mexican American and
non-Hispanic black individuals in ratio levels
were significant in all age groups (most p
<0.001) except in 5 groups (75-79, 80+ years in
males, and 70-74, 75-79, 80+ years in females).
Most of ratio differences between non-Hispanic
white and non-Hispanic black individuals were also
significant (most p<0.001), except in 6 age
groups (35-39 years in males, and 20-24, 25-29,
55-59, 70-74, 75-79 years in females). Most of the
comparisons between Mexican American and
non-Hispanic white individuals were not
significant, except in 6 age groups (55-59 years
in females, 9-11, 25-29, 35-39, 55-59, 60-64 years
in males. Figure 3 shows line graphs of the
TC/HDL-C ratio by race/ethnicity.
 |
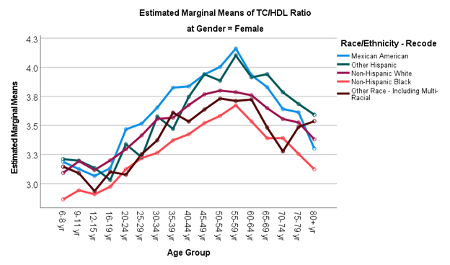 |
| Figure 3: Line graphs of the
TC/HDL-C ratio by race/ethnicity |
Discussion
Cholesterol levels
are important biomarkers associated with
cardiovascular disease and there are
well-documented race/ethnic disparities in
cardiovascular morbidity and mortality risk. The
TC/HDL-C ratio is an index of the potential for
developing blockages in the arteries of the heart.
In this study, we examined the trends in serum
lipoprotein ratio (TC/HDL-C) in more recent years
between 2005 and 2020 and compared the ratio
levels by race/ethnicity. The strengths of this
study included analysis of long-term trends; use
of substantially more data than previous analyses
allowing data stratification; and systematic
quantitative analysis of the trends.
Similar to previous
studies,11–13 our results supported the
favorable trends in lipid levels in the U.S.
population. As described by Perak et al.,11
it is important to understand the reasons for the
favorable lipid trends observed to acknowledge
public health successes and plan for future
efforts. Carroll et al.12 suggested
that the favorable trend may be due in part to a
decrease in consumption of trans-fatty acids or
other healthy lifestyle changes, an increase in
the percentage of adults taking lipid-lowering
medications, changes in cigarette smoking and
carbohydrate intake, and excluded that likelihood
of due to the changes in physical activity,
obesity, or intake of saturated fat. Nonetheless,
future studies should investigate the impact of
pandemic caused by severe acute respiratory
syndrome coronavirus 2 (SARS-CoV-2) in 2020 on
cardiovascular health in general population.
Similar to previous
studies,12–14 our results re-confirmed
that cholesterol levels changed by age and
differed by sex, and further supported the
race/ethnicity differences.8,29 Most of
the studies reported the individual cholesterols
(e.g., HDL-C,11–15,19,21,25 LDL-C,12–14,18,19,21,23
TC,11,13,13,14,17,19–22,24,26 non-HDL,11–13,21
and TG12–15,19,21). Few studies
described the distributions of TC/HDL-C lipid
ratios by age groups.6,27,28
Similar to
McIntosh’s study (2013),29 they also
demonstrated that the non-Hispanic black
individuals had lower mean TC/HDL-C (3.9 compared
to 5.1 in non-Hispanic white individuals) but the
statistics were averaged based on a sample of 97
individuals 20-75 years old. In a study by Willey
et al. (2011),8 the level of TC/HDL-C
was greatest in Hispanic (4.9 compared to 4.6 for
non-Hispanic whites and 4.2 for non-Hispanic
blacks). However, the results were averaged from a
sample of 1,445 community adults without
stratifying by age group. Our results further
supported that, the lower lipid ratio levels in
non-Hispanic black individuals were consistent
across most age ranges.
The lower mean
TC/HDL-C in non-Hispanic black individuals might
have been contributed to the differences in HDL-C
levels. In a NHANES-based study, Carroll et al.
(2012)12 showed that Mexican Americans,
non-Hispanic whites and non-Hispanic blacks had
similar mean TC levels, but non-Hispanic blacks
had a higher HDL-C (54.5 compared to 51.2 for
non-Hispanic white, and 48.9 for Mexican
American). Further studies should investigate the
race/ethnicity differences in cholesterol levels a
larger population with a broader set of
parameters.
Nonetheless,
according to Centers for Disease Control and
Prevention (CDC), the prevalence of CVD among
non-Hispanic black individuals (20.7% of deaths)
was similar to non-Hispanic white individuals
(21.3% of deaths) while Hispanic individuals had a
lower prevalence (15.8% of death). Clinically, the
risk of CVD does not solely depend on the
cholesterol levels, but also certain health
conditions (e.g., hypertension, history of
diabetes), lifestyle habits (e.g., alcohol intake,
tobacco use, diet, exercise) and access to medical
care (e.g., cholesterol-lowering medication).
Further work trying to assess the effects of lipid
profile components, certain health conditions,
lifestyle habits, access to medical care,
lipid-lowering medications, and CVD events
simultaneously is certainly warranted.
This study involves
several limitations. First, this study included
secondary data sources. The researchers were not
in control of the data collection procedures.
Missing values and data entry errors were not
correctable. NHANES uses several quality assurance
and quality control (QA/QC) protocols, which meet
the 1988 Clinical Laboratory Improvement Act
mandates, to monitor the quality of the analyses
performed by the contract laboratories. Our
analysis of trends was based on limited NHANES
survey periods. Data from other future surveys are
needed to confirm the favorable trends. We only
examined the TC/HDL-C ratio, different cholesterol
ratios could be explored. Several extraneous
factors could influence cholesterol levels, such
as lipid-lowering medications and history of
diabetes. We prioritized the maintenance of sample
size within each stratum to achieve stable
estimates of the lipoprotein ratio values. Future
studies should endeavor to describe the lipid
profile in US residents stratified by extraneous
variables. Future studies are needed to fill the
gaps in the fundamental knowledge of the factors
that influence the cardiovascular health across
the life span.
Conclusion
This nationally
representative study between 2005 and 2020, showed
favorable trends in lipid ratio levels that were
observed among noninstitutionalized residents in
the US. Further research is needed to determine
how racial/ethnic differences in cholesterol ratio
affect racial/ethnic differences in cardiovascular
disease rates.
Acknowledgements
This research did
not receive any specific grant from funding
agencies in the public, commercial, or
not-for-profit sectors. Copyrighted material was
not used. Copyrighted surveys/instruments/tools
were not used.
References
- Arnett DK, Blumenthal RS, Albert MA, et al.
2019 ACC/AHA Guideline on the Primary Prevention
of Cardiovascular Disease: Executive Summary. Circulation.
2019;140(11):e563-e595.
doi:10.1161/CIR.0000000000000677
- Grover SA, Coupal L, Kaouache M, Lowensteyn I.
Preventing cardiovascular disease among
Canadians: What are the potential benefits of
treating hypertension or dyslipidemia? Can J
Cardiol. 2007;23(6):467-473.
- Downs JR, O’Malley PG. Management of
dyslipidemia for cardiovascular disease risk
reduction: synopsis of the 2014 U.S. Department
of Veterans Affairs and U.S. Department of
Defense clinical practice guideline. Ann
Intern Med. 2015;163(4):291-297.
doi:10.7326/M15-0840
- Mach F, Baigent C, Catapano AL, et al. 2019
ESC/EAS Guidelines for the management of
dyslipidaemias: lipid modification to reduce
cardiovascular risk. Eur Heart J. 2020;41(1):111-188.
doi:10.1093/eurheartj/ehz455
- Writing Committee, Lloyd-Jones DM, Morris PB,
et al. 2022 ACC Expert Consensus Decision
Pathway on the Role of Nonstatin Therapies for
LDL-Cholesterol Lowering in the Management of
Atherosclerotic Cardiovascular Disease Risk: A
Report of the American College of Cardiology
Solution Set Oversight Committee. J Am Coll
Cardiol. 2022;80(14):1366-1418.
doi:10.1016/j.jacc.2022.07.006
- Calling S, Johansson SE, Wolff M, Sundquist J,
Sundquist K. Total cholesterol/HDL-C ratio
versus non-HDL-C as predictors for ischemic
heart disease: a 17-year follow-up study of
women in southern Sweden. BMC Cardiovasc
Disord. 2021;21(1):163.
doi:10.1186/s12872-021-01971-1
- Fodor JG, Frohlich JJ, Genest JJ, McPherson
PR. Recommendations for the management and
treatment of dyslipidemia. Report of the Working
Group on Hypercholesterolemia and Other
Dyslipidemias. CMAJ Can Med Assoc J J Assoc
Medicale Can. 2000;162(10):1441-1447.
- Willey JZ, Rodriguez CJ, Carlino RF, et al.
Race-ethnic differences in the relationship
between lipid profile components and risk of
myocardial infarction: the Northern Manhattan
Study. Am Heart J. 2011;161(5):886-892.
doi:10.1016/j.ahj.2011.01.018
- Millán J, Pintó X, Muñoz A, et al. Lipoprotein
ratios: Physiological significance and clinical
usefulness in cardiovascular prevention. Vasc
Health Risk Manag. 2009;5:757-765.
- Farzadfar F, Finucane MM, Danaei G, et al.
National, regional, and global trends in serum
total cholesterol since 1980: systematic
analysis of health examination surveys and
epidemiological studies with 321 country-years
and 3·0 million participants. Lancet Lond
Engl. 2011;377(9765):578-586.
doi:10.1016/S0140-6736(10)62038-7
- Perak AM, Ning H, Kit BK, et al. Trends in
Levels of Lipids and Apolipoprotein B in US
Youths Aged 6 to 19 Years, 1999-2016. JAMA.
2019;321(19):1895-1905.
doi:10.1001/jama.2019.4984
- Carroll MD, Kit BK, Lacher DA, Shero ST,
Mussolino ME. Trends in lipids and lipoproteins
in US adults, 1988-2010. JAMA.
2012;308(15):1545-1554.
doi:10.1001/jama.2012.13260
- Kit BK, Carroll MD, Lacher DA, Sorlie PD,
DeJesus JM, Ogden C. Trends in serum lipids
among US youths aged 6 to 19 years, 1988-2010. JAMA.
2012;308(6):591-600. doi:10.1001/jama.2012.9136
- Carroll MD, Lacher DA, Sorlie PD, et al.
Trends in serum lipids and lipoproteins of
adults, 1960-2002. JAMA.
2005;294(14):1773-1781.
doi:10.1001/jama.294.14.1773
- Palmer MK, Toth PP. Trends in Lipids, Obesity,
Metabolic Syndrome, and Diabetes Mellitus in the
United States: An NHANES Analysis (2003-2004 to
2013-2014). Obes Silver Spring Md.
2019;27(2):309-314. doi:10.1002/oby.22370
- Wang I, Hou S, Rahman MH, Li X, Ritchie D,
Spector AL. Trends in Low-Density Lipoproteins
Cholesterol (LDL-C) in US Aged 12 to 80 Years:
Data from the 2007-2018 National Health and
Nutrition Examination Survey (NHANES). J
Neurol Epidemiol. 2022;7:19-25.
doi:10.12974/2309-6179.2022.07.03
- Mehdipour P, Mohammadi E, Sepanlou SG, et al.
Level and trend of total plasma cholesterol in
national and subnational of Iran: a systematic
review and age-spatio-temporal analysis from
1990 to 2016. J Diabetes Metab Disord.
2022;21(2):1301-1315.
doi:10.1007/s40200-022-01052-w
- Wan KS, Hairi NN, Mustapha F, Ismail M, Mohd
Yusoff MF, Moy FM. Five-year LDL-cholesterol
trend and its predictors among type 2 diabetes
patients in an upper-middle-income country: a
retrospective open cohort study. Peer J.
2022;10:e13816. doi:10.7717/peerj.13816
- Song PK, Man QQ, Li H, et al. Trends in Lipids
Level and Dyslipidemia among Chinese Adults,
2002-2015. Biomed Environ Sci BES. 2019;32(8):559-570.
doi:10.3967/bes2019.074
- Chan T, Dabin B, Hyun K, et al. Falling
cholesterol trend at acute coronary syndrome
presentation is strongly related to statin use
for secondary prevention. Int J Cardiol. 2016;212:192-197.
doi:10.1016/j.ijcard.2016.03.038
- Gupta R, Sharma M, Goyal NK, Bansal P, Lodha
S, Sharma KK. Gender differences in 7 years
trends in cholesterol lipoproteins and lipids in
India: Insights from a hospital database. Indian
J Endocrinol Metab. 2016;20(2):211-218.
doi:10.4103/2230-8210.176362
- Hosseini M, Yousefifard M, Taslimi S, et al.
Trend of blood cholesterol level in Iran:
results of four national surveys during
1991-2008. Acta Med Iran. 2013;51(9):642-651.
- Ferrières J, Bongard V, Dallongeville J, et
al. Trends in plasma lipids, lipoproteins and
dyslipidaemias in French adults, 1996-2007. Arch
Cardiovasc Dis. 2009;102(4):293-301.
doi:10.1016/j.acvd.2009.02.002
- Ogura T, Matsuura K, Suzuki H, et al. Serum
total cholesterol of new students enrolled at
Okayama University: trend during 1989-1998.
Acta Med Okayama. 2001;55(5):269-276.
doi:10.18926/AMO/32015
- Salomaa VV, Jauhiainen M, Pietinen P, et al.
Five-year trend in serum HDL-lipoprotein
cholesterol in the Finnish population aged 25-64
years. A suggestion of an increase. Atherosclerosis.
1991;86(1):39-48.
doi:10.1016/0021-9150(91)90097-m
- Verschuren WM, Al M, Blokstra A, Boerma GJ,
Kromhout D. Trend in serum total cholesterol
level in 110,000 young adults in The
Netherlands, 1974 to 1986. Am J Epidemiol.
1991;134(11):1290-1302.
doi:10.1093/oxfordjournals.aje.a116032
- Ridker PM, Rifai N, Cook NR, Bradwin G, Buring
JE. Non-HDL cholesterol, apolipoproteins A-I and
B100, standard lipid measures, lipid ratios, and
CRP as risk factors for cardiovascular disease
in women. JAMA. 2005;294(3):326-333.
doi:10.1001/jama.294.3.326
- von Mühlen D, Langer RD, Barrett-Connor E. Sex
and time differences in the associations of
non-high-density lipoprotein cholesterol versus
other lipid and lipoprotein factors in the
prediction of cardiovascular death (The Rancho
Bernardo Study). Am J Cardiol.
2003;91(11):1311-1315.
doi:10.1016/s0002-9149(03)00319-9
- McIntosh MS, Kumar V, Kalynych C, et al.
Racial Differences in Blood Lipids Lead to
Underestimation of Cardiovascular Risk in Black
Women in a Nested observational Study. Glob
Adv Health Med. 2013;2(2):76-79.
doi:10.7453/gahmj.2012.076
|


